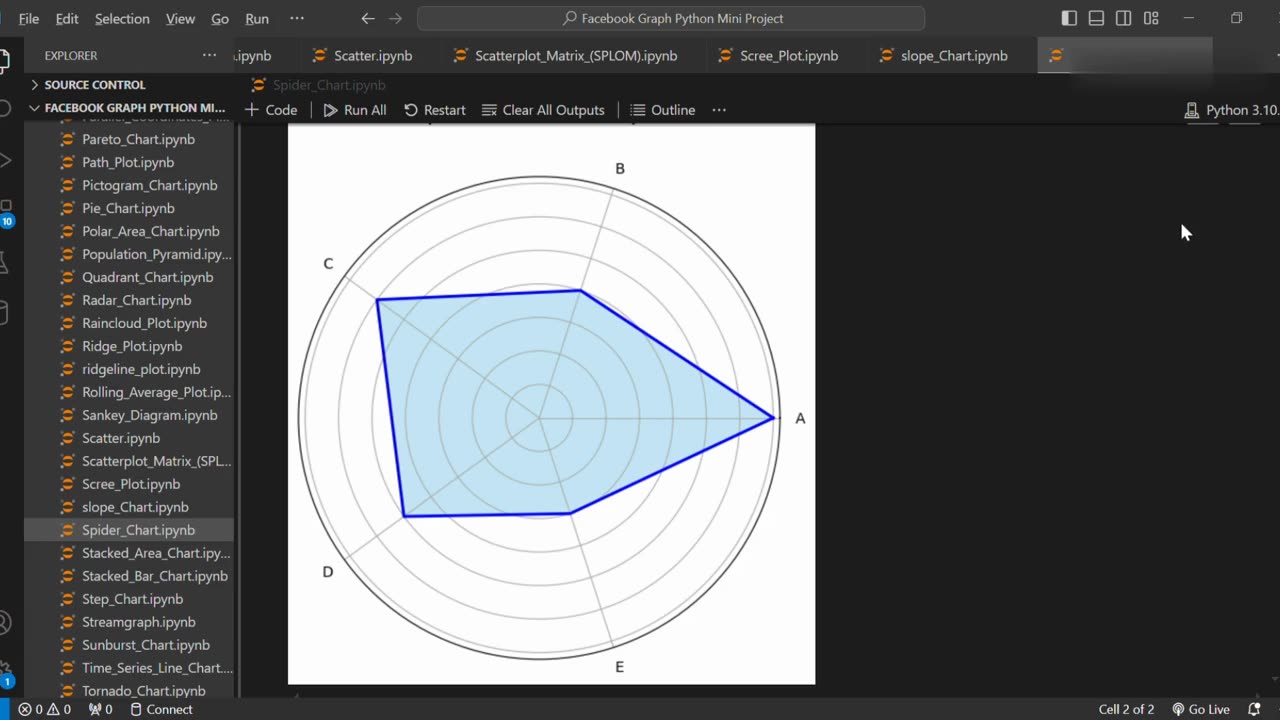
Create Spider Chart Using Python
3 months ago
4
A Spider Chart (also known as a Radar Chart) is a graphical method used to display multivariate data in a way that highlights differences between multiple variables. Using Python libraries like matplotlib, you can easily create customizable spider charts to visualize performance metrics, skill comparisons, or survey data.
Loading 2 comments...
-
 1:05
1:05
AI Evolutionary Technology
12 days agoCreate Your Own Python Decorator | Repeat Functions Like a Pro
7 -
 34:40
34:40
Donald Trump Jr.
6 hours agoWe Will Make Charlie Proud | TRIGGERED Ep.276
161K81 -
 1:01:49
BonginoReport
5 hours agoErika Kirk Forgives Charlie’s Assassin - Nightly Scroll w/ Hayley Caronia (Ep.139)
61.2K61 -
 LIVE
LIVE
megimu32
2 hours agoOn The Subject: Rush Hour | Would It Be Cancelled Today?
122 watching -
 1:24:12
Katie Miller Pod
4 hours ago $0.72 earnedEpisode 7 - Jillian Michaels | The Katie Miller Podcast
53.5K3 -
 LIVE
LIVE
LFA TV
1 day agoLFA TV ALL DAY STREAM ! | MONDAY 9/22/25
704 watching -
 1:02:10
LIVE WITH CHRIS'WORLD
4 hours agoLIVE WITH CHRIS'WORLD - Key Takeaways From Charlie Kirks Memorial
18.3K -
 1:37:17
Liberty Sentinel
6 days agoURGENT: Dr. Malone Warns of "Vaccine Cult" & Effort to "Fix God Gene" With Shots
14.2K8 -
 LIVE
LIVE
Rallied
5 hours ago $0.94 earnedHigh Octane Warzone Wins All Night
65 watching -
 8:35
8:35
Adam Does Movies
10 hours ago $0.58 earnedHIM - Movie Review
21.1K4