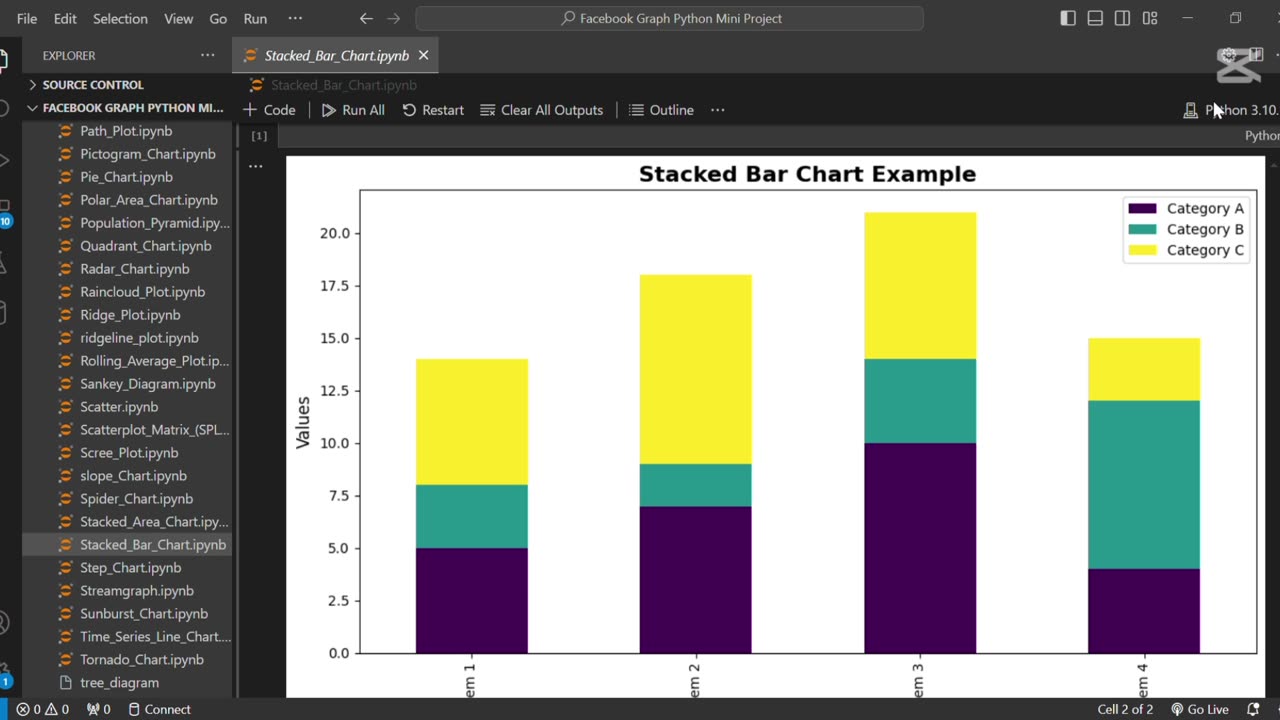
Create stacked bar chart using Python 📊
Loading comments...
-
 1:02
1:02
AI Evolutionary Technology
1 month agoLive Weather App in Python | BeautifulSoup & Web Scraping Tutorial
81 -
 LIVE
LIVE
SpartakusLIVE
8 hours agoSNIPING in Battlefield 6 - REDSEC || Monday MOTIVATION to CONQUER the Week
164 watching -
 49:25
49:25
ThisIsDeLaCruz
4 hours ago $4.69 earnedBack Stage Pass with Avenged Sevenfold
40.3K7 -
 6:43:40
GritsGG
9 hours agoWorld Record Win Streak Attempt! #1 Most Wins 3880+!
20.6K1 -
 3:12:05
Tundra Tactical
6 hours ago $10.28 earnedProfessional Gun Nerd Plays Battlefield 6
51.6K5 -
 1:01:12
Donald Trump Jr.
9 hours agoThe China Matrix with Journalist Lee Smith | TRIGGERED Ep.288
142K86 -
 11:56:00
Dr Disrespect
14 hours ago🔴LIVE - DR DISRESPECT - ARC RAIDERS - FULL SEND INTO THE RED
157K18 -
 5:17:51
JdaDelete
5 hours ago $0.35 earnedFinally playing Eldin Ring | First Playthrough Episode 2
12.1K3 -
 1:02:08
BonginoReport
7 hours agoNicki Minaj Speaks Out Against Christian Persecution - Nightly Scroll w/ Hayley Caronia (Ep.169)
67.6K51 -
 5:23:36
HomieQuest
7 hours agoLive Streaming! Pokemon Legends Z-A
4.82K4