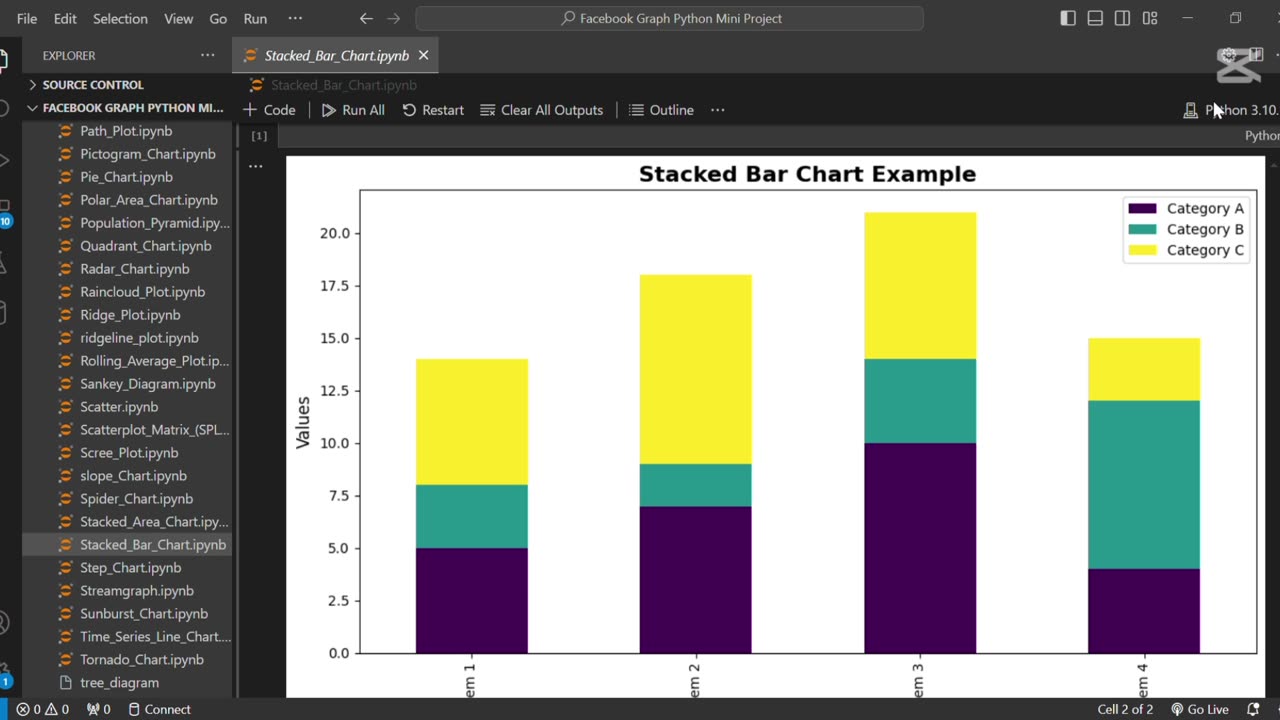
Create stacked bar chart using Python 📊
Loading comments...
-
 0:16
0:16
AI Evolutionary Technology
2 months agoCreate Email Check Account Services Using Python
9 -

The Bubba Army
3 days ago"ROB REINER MURDERED" By His Own Son? - Bubba the Love Sponge® Show | 12/15/25
8.82K -
 17:09
17:09
Professor Nez
1 hour agoObama’s Operative Just Got HUMILIATED After Trying to IMPEACH America!
9.8K17 -
 LIVE
LIVE
LFA TV
19 hours agoLIVE & BREAKING NEWS! | MONDAY 12/15/25
3,966 watching -
 59:10
59:10
VINCE
4 hours agoViolence Across The World: Brown University, Australia, Syria | Episode 188 - 12/15/25 VINCE
204K110 -
 LIVE
LIVE
The Shannon Joy Show
2 hours ago🔥SJ LIVE Dec 15 - A Violent Weekend, A Peoples Coup In Bulgaria & A Trump EO For Big Tech Granting Immunity & Supremacy🔥
196 watching -
 50:00
50:00
Grant Stinchfield
1 hour agoThe Cost of Wokeness... Disarmament Is the Danger
2.52K2 -
 2:28:14
Nikko Ortiz
2 hours agoReaction Time With Special Guest... | Rumble LIVE
26.1K -
 1:43:14
Caleb Hammer
15 hours agoFinancial Audit's Messiest Divorce
16.9K2 -
 1:34:42
Graham Allen
4 hours agoErika Kirk & Candace Owens Meet TODAY!!! Candace is DONE! + Radical Islam Is Destroying The World!
146K579