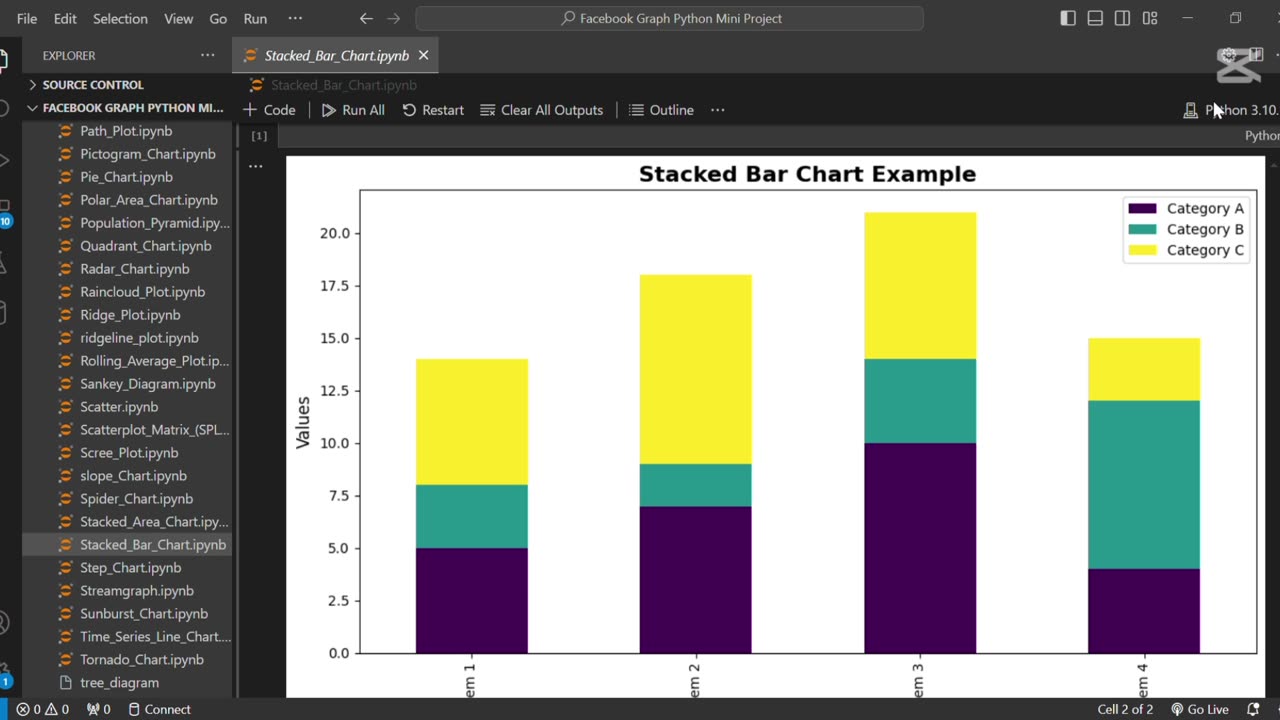
Create stacked bar chart using Python 📊
Loading comments...
-
 0:09
0:09
AI Evolutionary Technology
4 days agoCreate Customs Custom Heart ASCII Art Using Python
31 -
 1:34:23
Glenn Greenwald
6 hours agoSydney Shooting Exploited for Pro-Israel Censorship and Anti-Muslim Crackdowns; How Media DEI Was the Opposite of Diversity | SYSTEM UPDATE #559
120K93 -
 1:09:01
MattMorseTV
4 hours ago $0.79 earned🔴Trump just handed Congress THE EVIDENCE.🔴
38.2K87 -
 1:01:54
BonginoReport
6 hours agoVanity Fair Goes Nuclear On Trump’s Inner Circle - Nightly Scroll w/ Hayley Caronia (Ep.198)
137K53 -
 53:25
53:25
Katie Miller Pod
7 hours ago $5.88 earnedFBI Director Kash Patel & Alexis Wilkins on Balancing Their Relationship with Work | KMP Ep.19
35.8K25 -
 1:15:37
Candace Owens
6 hours agoErika And I Sat Down. Here’s What Happened. | Candace Ep 280
202K708 -
 2:06:47
Quite Frankly
9 hours agoDestroying the West to Save the West? | J Gulinello | 12/16/25
47.2K11 -
 13:51
13:51
ARFCOM News
7 hours ago $0.11 earnedShould Bystander Have Blasted? + DOJ Lawyers: Don't Make Us Defend Gun Rights! + How To STOP Flock?
41.6K12 -
 1:04:59
TheCrucible
7 hours agoThe Extravaganza! EP: 75 (12/16/25)
97.6K14 -
 1:13:35
Kim Iversen
6 hours agoTurtle Island Terror: A Narrative That Serves Israel
57K121