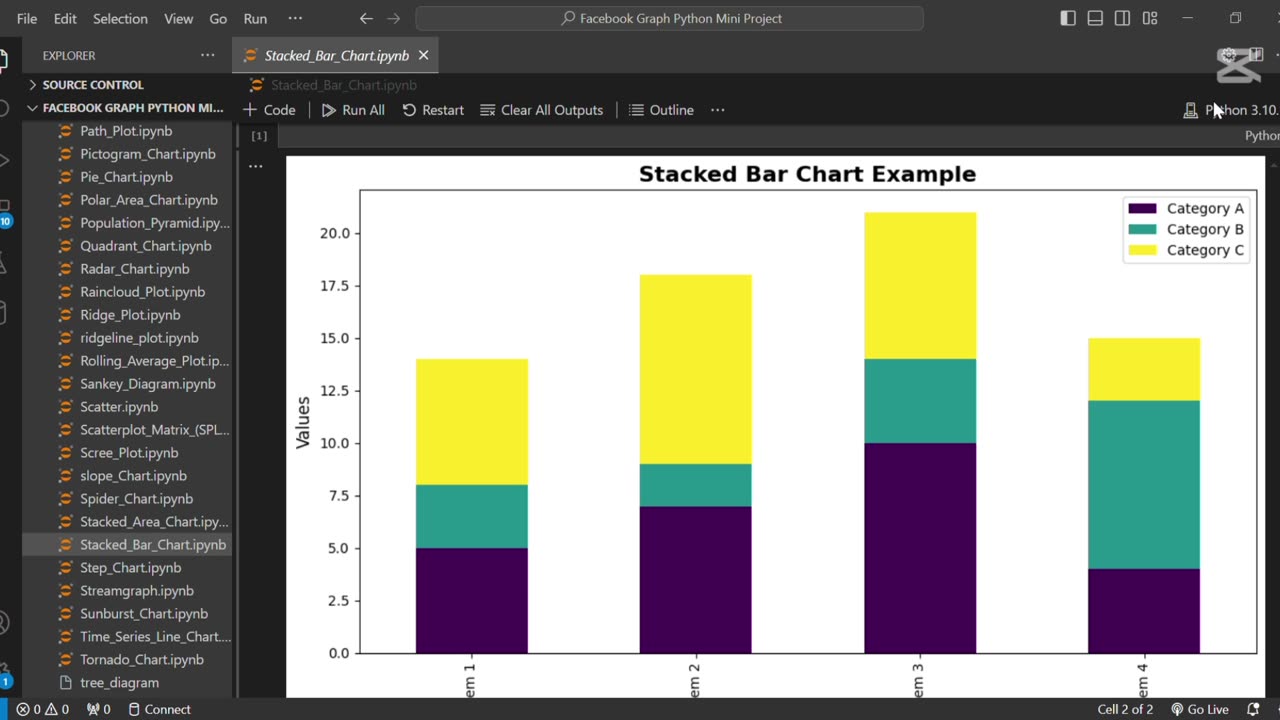
Create stacked bar chart using Python 📊
Loading comments...
-
 1:06
1:06
AI Evolutionary Technology
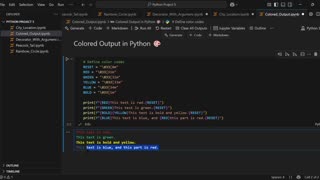
4 days agoAdd Stunning Colors to Your Python Console | Text Styling Made Easy
7 -
 LIVE
LIVE
Man in America
7 hours agoLIVE: Assassin Story DOESN'T ADD UP! What Are They HIDING From Us?? | LET'S TALK
2,256 watching -
 2:24:17
Barry Cunningham
4 hours agoFOR PRESIDENT TRUMP WILL TAKE NO PRISONERS AND THE LIBS SHOULD EXPECT NO MERCY!
46.1K39 -
 1:08:41
Savanah Hernandez
4 hours agoCharlie Kirk Was Our Bridge And The Left Burned It
10.2K28 -
 LIVE
LIVE
Flyover Conservatives
6 hours agoFinancial Web Behind Charlie Kirk's Murder with Mel K | Silver On It's Way to $50 | FOC Show
1,337 watching -
 LIVE
LIVE
We Like Shooting
15 hours ago $0.35 earnedWe Like Shooting 628 (Gun Podcast)
143 watching -
 1:09:26
Glenn Greenwald
6 hours agoTrump's Shifting Immigration and H-1B Policies: With Journalist Lee Fang and Political Science Professor Ron Hira | SYSTEM UPDATE #515
151K32 -
 13:09:23
LFA TV
1 day agoLFA TV ALL DAY STREAM - MONDAY 9/15/25
243K60 -
 54:12
54:12
Donald Trump Jr.
5 hours agoCharlie's Vision. Our Future. | TRIGGERED Ep274
187K120 -
 1:03:35
BonginoReport
6 hours agoKirk’s Alleged Killer Dating Hateful Transgender??? - Nightly Scroll w/ Hayley Caronia (Ep.134)
118K138