Create Streamgraph Using Python
4 months ago
8
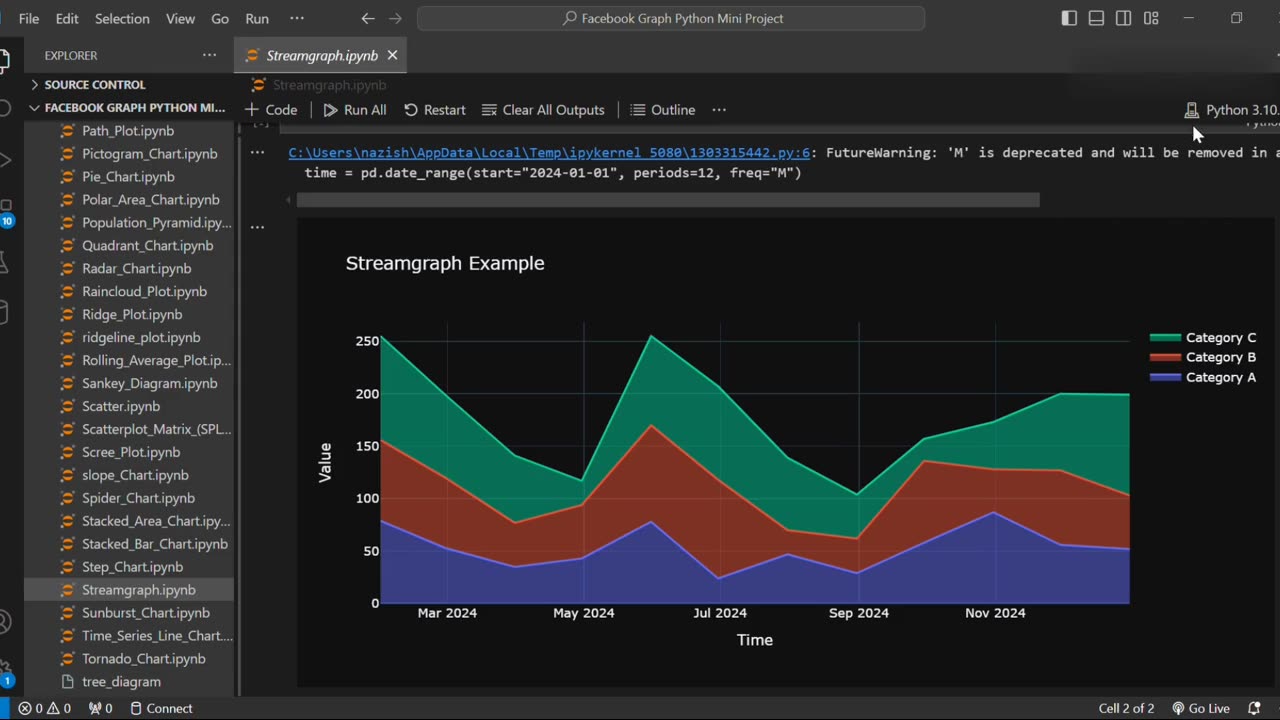
Create Streamgraph Using Python | Data Visualization Tutorial
Want to visualize changes in data over time with a smooth and flowing design? 🌊
In this tutorial, you'll learn how to create stunning Streamgraphs using Python with libraries like Matplotlib and Plotly.
📌 What You’ll Learn:
What a streamgraph is
When and why to use streamgraphs
Step-by-step guide to creating a streamgraph in Python
Customizing colors, labels, and layout for better insights
Perfect for time series and category-based data! 📈
Loading comments...
-
 0:20
0:20
AI Evolutionary Technology
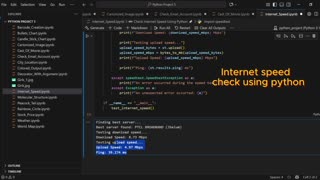
1 month agoUsing Python to Analyze Your Internet Connection
91 -
 2:06:09
Inverted World Live
6 hours agoMysterious Crash at Area 51 | Ep. 134
5.87K2 -
 2:48:59
TimcastIRL
4 hours agoTrump Endorses Cuomo, Says NO COMMIE MAMDANI, Obama REFUSES To Endorse Mamdani | Timcast IRL
197K124 -
 LIVE
LIVE
Drew Hernandez
22 hours agoGOP CIVIL WAR: TUCKER CARLSON DERANGEMENT SYNDROME AT ALL TIME HIGH
1,151 watching -
 14:44
14:44
Sponsored By Jesus Podcast
1 day agoYou Can't Serve God & MONEY | Is Money the Root of All Evil?
5.44K14 -
 2:47:28
Barry Cunningham
8 hours agoYOU'VE BEEN MISINFORMED! GREED IS ACTUALLY GOOD! ESPECIALLY NOW! (AND MORE NEWS)
69.5K31 -
 LIVE
LIVE
SpartakusLIVE
8 hours agoSNIPING in Battlefield 6 - REDSEC || Monday MOTIVATION to CONQUER the Week
169 watching -
 49:25
49:25
ThisIsDeLaCruz
4 hours ago $4.69 earnedBack Stage Pass with Avenged Sevenfold
40.3K7 -
 6:43:40
GritsGG
9 hours agoWorld Record Win Streak Attempt! #1 Most Wins 3880+!
14.8K1 -
 3:12:05
Tundra Tactical
6 hours ago $10.28 earnedProfessional Gun Nerd Plays Battlefield 6
51.6K5