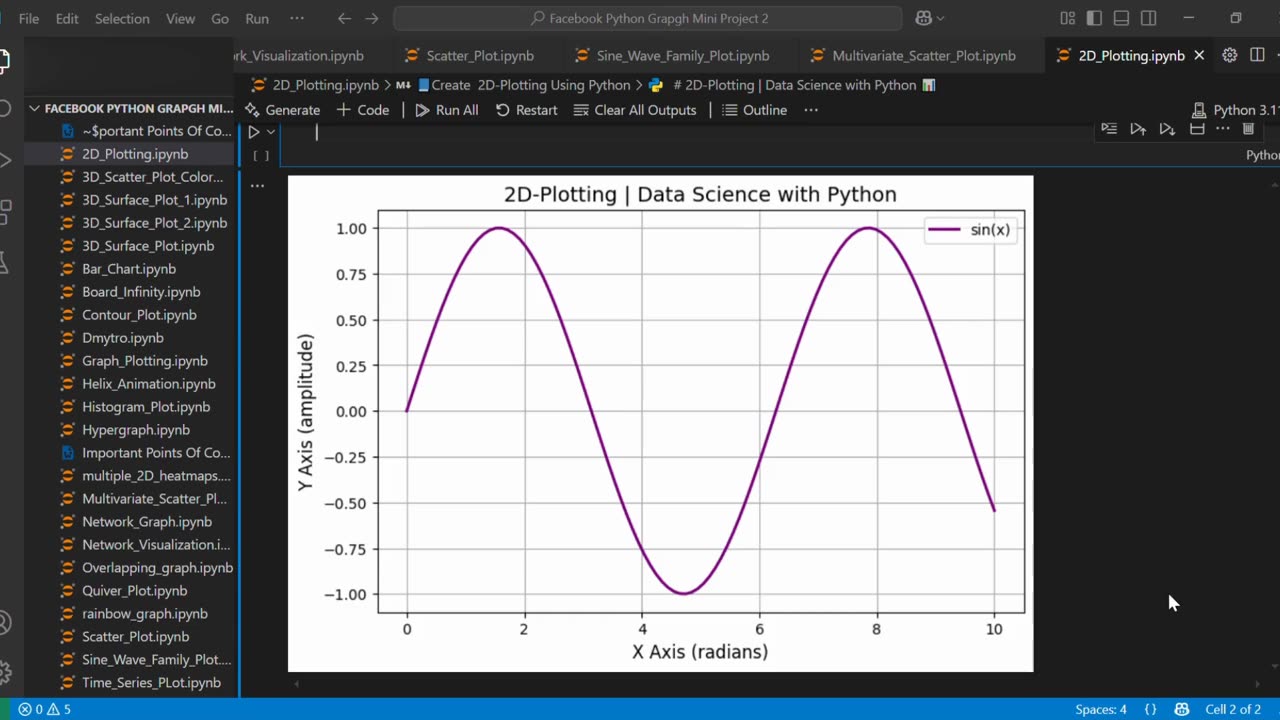
🔷 Create 2D-Line Plot Using Python 📈🐍
Loading 1 comment...
-
 0:16
0:16
AI Evolutionary Technology
1 month agoCreate Email Check Account Services Using Python
7 -
 2:48:59
TimcastIRL
4 hours agoTrump Endorses Cuomo, Says NO COMMIE MAMDANI, Obama REFUSES To Endorse Mamdani | Timcast IRL
244K124 -
 LIVE
LIVE
Drew Hernandez
22 hours agoGOP CIVIL WAR: TUCKER CARLSON DERANGEMENT SYNDROME AT ALL TIME HIGH
1,151 watching -
 14:44
14:44
Sponsored By Jesus Podcast
1 day agoYou Can't Serve God & MONEY | Is Money the Root of All Evil?
5.44K14 -
 2:47:28
Barry Cunningham
8 hours agoYOU'VE BEEN MISINFORMED! GREED IS ACTUALLY GOOD! ESPECIALLY NOW! (AND MORE NEWS)
80.8K31 -
 LIVE
LIVE
SpartakusLIVE
8 hours agoSNIPING in Battlefield 6 - REDSEC || Monday MOTIVATION to CONQUER the Week
169 watching -
 49:25
49:25
ThisIsDeLaCruz
4 hours ago $4.69 earnedBack Stage Pass with Avenged Sevenfold
40.3K7 -
 6:43:40
GritsGG
9 hours agoWorld Record Win Streak Attempt! #1 Most Wins 3880+!
20.6K1 -
 3:12:05
Tundra Tactical
6 hours ago $10.28 earnedProfessional Gun Nerd Plays Battlefield 6
51.6K5 -
 1:01:12
Donald Trump Jr.
9 hours agoThe China Matrix with Journalist Lee Smith | TRIGGERED Ep.288
142K86