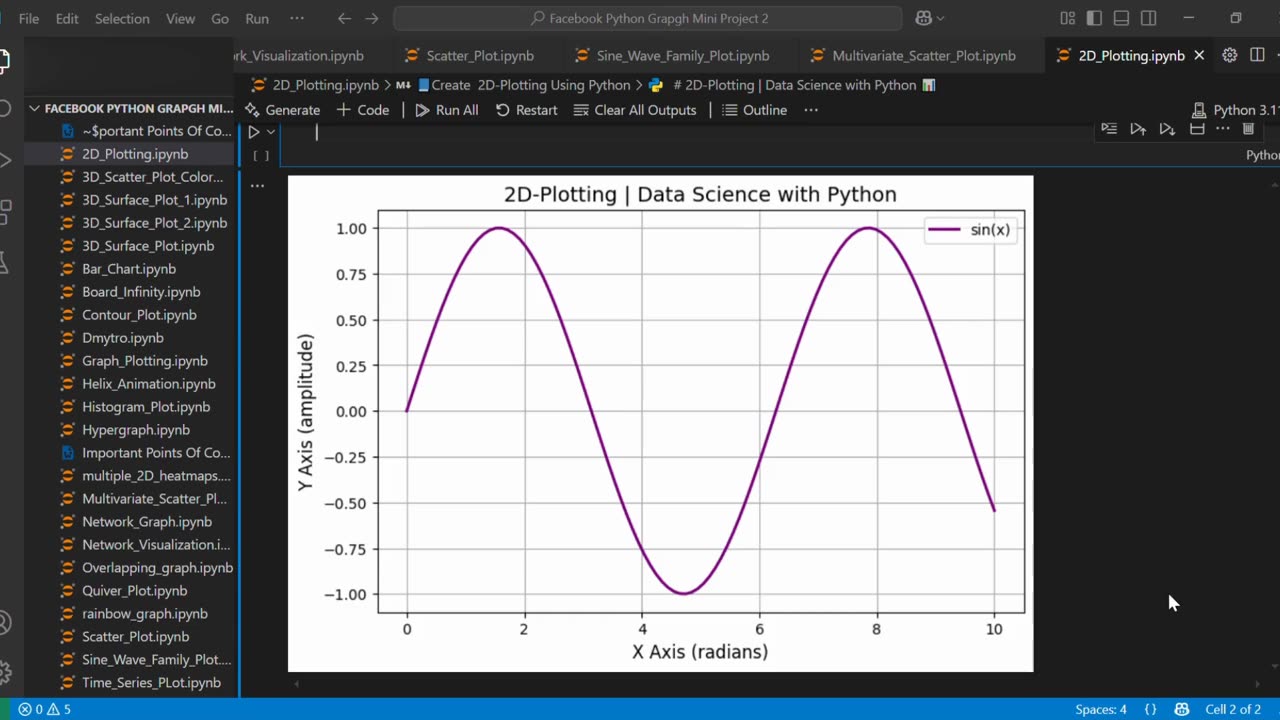
🔷 Create 2D-Line Plot Using Python 📈🐍
Loading 1 comment...
-
 0:09
0:09
AI Evolutionary Technology
7 days agoCreate Customs Custom Heart ASCII Art Using Python
31 -
 34:43
34:43
DeVory Darkins
3 hours agoBREAKING: Jury hands Democrat Judge a GUILTY Verdict after she helped illegal aliens escape
15.9K44 -
 37:49
37:49
theyoungrightusa
14 hours ago $3.37 earnedThe Young Right X AmFest
13.4K2 -
 2:02:50
The Culture War with Tim Pool
4 hours agoThe FALL of Candace Owens | The Culture War with Tim Pool
218K306 -
 1:14:53
Sean Unpaved
2 hours agoThe College Football Playoff Begins Today With Alabama vs. Oklahoma | UNPAVED
13.3K -
 1:36:33
Misfits Mania
2 days ago $14.03 earnedMISFITS MANIA: Weigh-In & Award Ceremony
51.6K9 -
 LIVE
LIVE
Dr Disrespect
4 hours ago🔴LIVE - DR DISRESPECT - ARC RAIDERS - THE FINISH LINE
1,055 watching -
 47:31
47:31
Watchmen Action: Ezekiel 33:6 - Equip The Church To Engage The Culture
5 hours ago $1.35 earnedThe Watchmen Brief LIVE From AmFest2025!
22.2K1 -
 1:00:45
Graham Allen
4 hours agoLive From AMFEST 2025: Day 2
48.2K38 -
 LIVE
LIVE
LFA TV
11 hours agoLIVE & BREAKING NEWS! | FRIDAY 12/19/25
1,271 watching