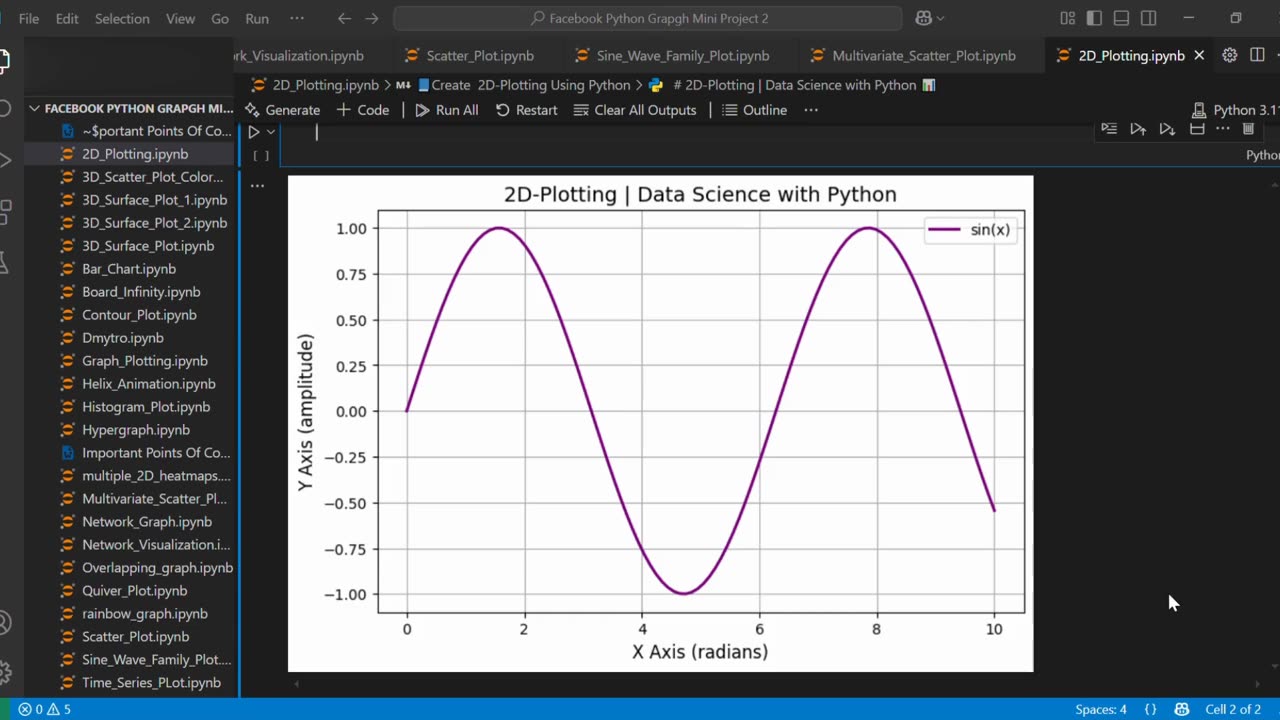
🔷 Create 2D-Line Plot Using Python 📈🐍
Loading 1 comment...
-
 1:15
1:15
AI Evolutionary Technology
7 days agoCreating a Stunning Peacock Tail Pattern with Python & Matplotlib
41 -
 16:37
16:37
Professor Nez
3 hours ago🚨Internet MELTS DOWN over JD Vance & Trump BREAKING the Democrats!
25.5K112 -
 LIVE
LIVE
Major League Fishing
4 days agoLIVE! - Fishing Clash Team Series: Heritage Cup - Day 1
1,534 watching -
 18:40
18:40
itsSeanDaniel
5 hours agoPiers Morgan CALLED OUT and HUMILIATED by Andrew Tate
31.6K218 -
 LIVE
LIVE
Times Now World
2 days agoLIVE: "ON CAM: How the Charlie Kirk Shooter ESCAPED – Shocking New Footage Revealed!"
365 watching -
 1:45:51
Game On!
1 day ago $10.94 earnedWise Guys Reveal NFL Week 2 BEST BETS Now
71.9K8 -
 26:57
26:57
Robbi On The Record
2 days agoMouth Breathing Is Why You’re Exhausted | with Dr. Melanie Silvestrini
38.7K5 -
 LIVE
LIVE
Total Horse Channel
7 hours ago2025 Reno Snaffle Bit Futurity | Sunday Finals
118 watching -
 40:44
40:44
SouthernbelleReacts
7 days ago $3.75 earned“Event Horizon (1997) Reaction | Hellraiser in Space with Sam Neill & Laurence Fishburne”
41.6K4 -
 10:49
10:49
Artur Stone Garage
3 days ago $2.64 earnedI Spent $2000 on My Turbo Honda Civic Build (Before & After)
41K10