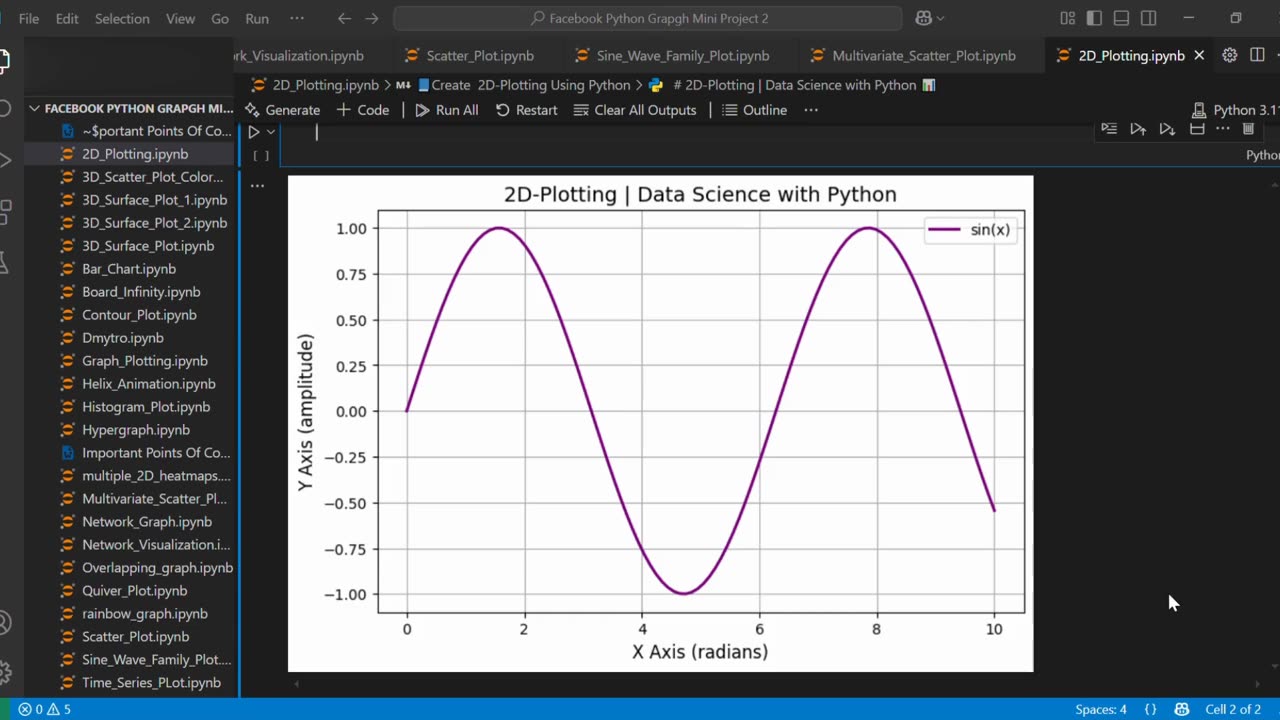
🔷 Create 2D-Line Plot Using Python 📈🐍
Loading 1 comment...
-
 1:02
1:02
AI Evolutionary Technology
10 days agoLive Weather App in Python | BeautifulSoup & Web Scraping Tutorial
21 -
 LIVE
LIVE
Drew Hernandez
6 hours agoDISNEY CUCKS FOR KIMMEL & ADDRESSING THE CHARLIE KIRK MEMORIAL AFTERMATH
723 watching -
 LIVE
LIVE
Flyover Conservatives
5 hours agoThe Most Overlooked Way to Fight Abortion (It’s Not Protests) - Robert Netzly; Why Triple-Digit Silver is Coming - Dr. Kirk Elliott | FOC Show
191 watching -
 1:55:33
Glenn Greenwald
5 hours agoDeceitful Hysteria over Tucker's Speech on Kirk; IDF Funder Larry Ellison to Take Over CBS, Paramount, and now TikTok; U.S. Embraces Leading Al-Qaeda Terrorist | SYSTEM UPDATE #519
133K34 -
 34:40
34:40
Donald Trump Jr.
6 hours agoWe Will Make Charlie Proud | TRIGGERED Ep.276
161K81 -
 1:01:49
BonginoReport
5 hours agoErika Kirk Forgives Charlie’s Assassin - Nightly Scroll w/ Hayley Caronia (Ep.139)
61.2K60 -
 LIVE
LIVE
megimu32
2 hours agoOn The Subject: Rush Hour | Would It Be Cancelled Today?
122 watching -
 1:24:12
Katie Miller Pod
4 hours ago $1.83 earnedEpisode 7 - Jillian Michaels | The Katie Miller Podcast
53.5K3 -
 LIVE
LIVE
LFA TV
1 day agoLFA TV ALL DAY STREAM ! | MONDAY 9/22/25
704 watching -
 1:02:10
LIVE WITH CHRIS'WORLD
4 hours agoLIVE WITH CHRIS'WORLD - Key Takeaways From Charlie Kirks Memorial
18.3K