🧭 Create Plot of a 2D Vector Field using Python 🌀📊
3 months ago
3
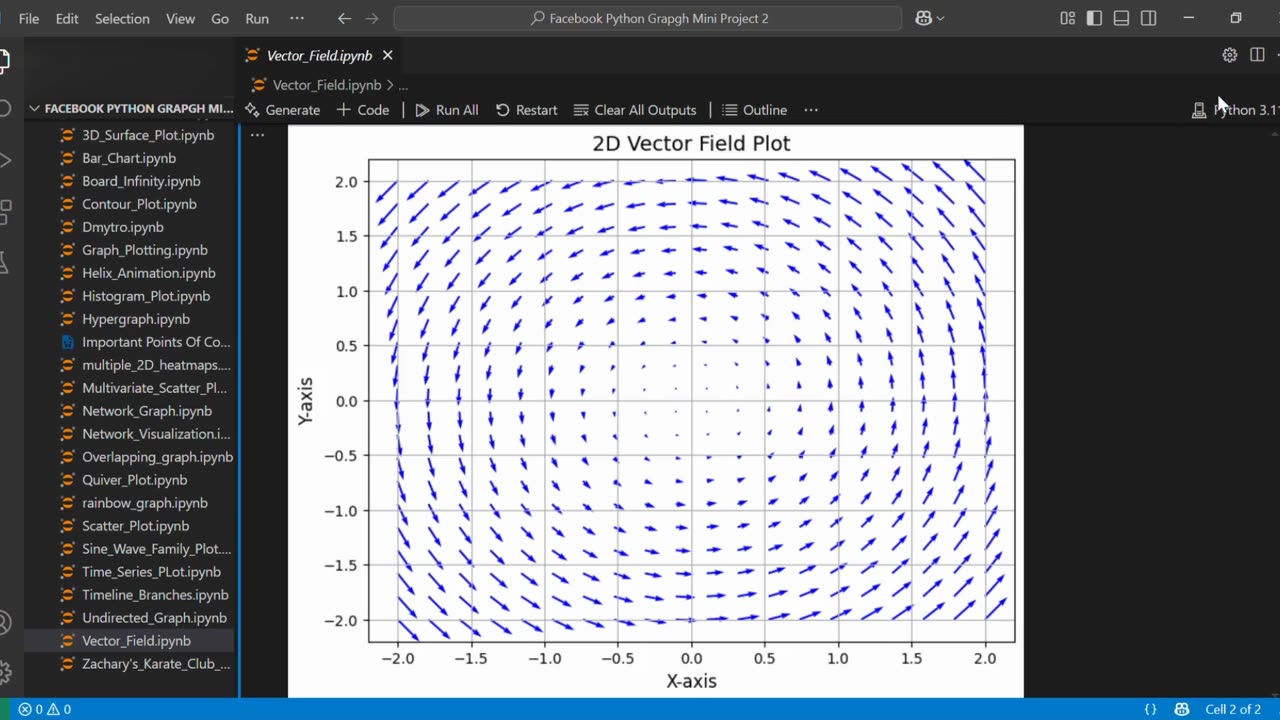
🧭 Create Plot of a 2D Vector Field using Python 🌀📊
Visualize the direction and magnitude of vectors across a 2D plane using Python’s powerful libraries like Matplotlib and NumPy. This type of plot is ideal for representing fields like wind flow, electric fields, or gradients in physics and engineering.
Loading comments...
-
 0:17
0:17
AI Evolutionary Technology
11 days agoVisualizing Molecular Structure From SMILES Using RDKit 🧪
1 -

Benny Johnson
2 hours ago🚨James Comey INDICTED for Perjury and Obstruction, Years In JAIL | 275 FEDS in January 6th Crowd
30.1K23 -
 1:35:48
Dear America
3 hours agoBOMBSHELL: 274+ Feds Where in The Crowd On Jan 6th!! + James Comey Finally INDICTED!!
126K88 -
 LIVE
LIVE
Badlands Media
7 hours agoBadlands Daily: September 26, 2025
1,529 watching -
 2:44:51
Matt Kohrs
13 hours agoPCE Inflation Report, BTFD & Payday Friday || Live Trading Stock Market Open
49.7K1 -
 LIVE
LIVE
Wendy Bell Radio
7 hours agoWelcome To The "Find Out" Phase
6,752 watching -
 LIVE
LIVE
GritsGG
2 hours agoQuad Win Streaks!🫡 Most Wins in WORLD! 3600+
67 watching -
 56:54
56:54
Crypto Power Hour
3 hours ago $0.87 earnedSpecial Guest Natalie Brunell, Author & Bitcoin Maxi
20.4K8 -
 LIVE
LIVE
Total Horse Channel
15 hours agoAMHA 2025 World Show 9/26
305 watching -
 LIVE
LIVE
LFA TV
19 hours agoBREAKING NEWS ALL DAY! | FRIDAY 9/26/25
3,812 watching