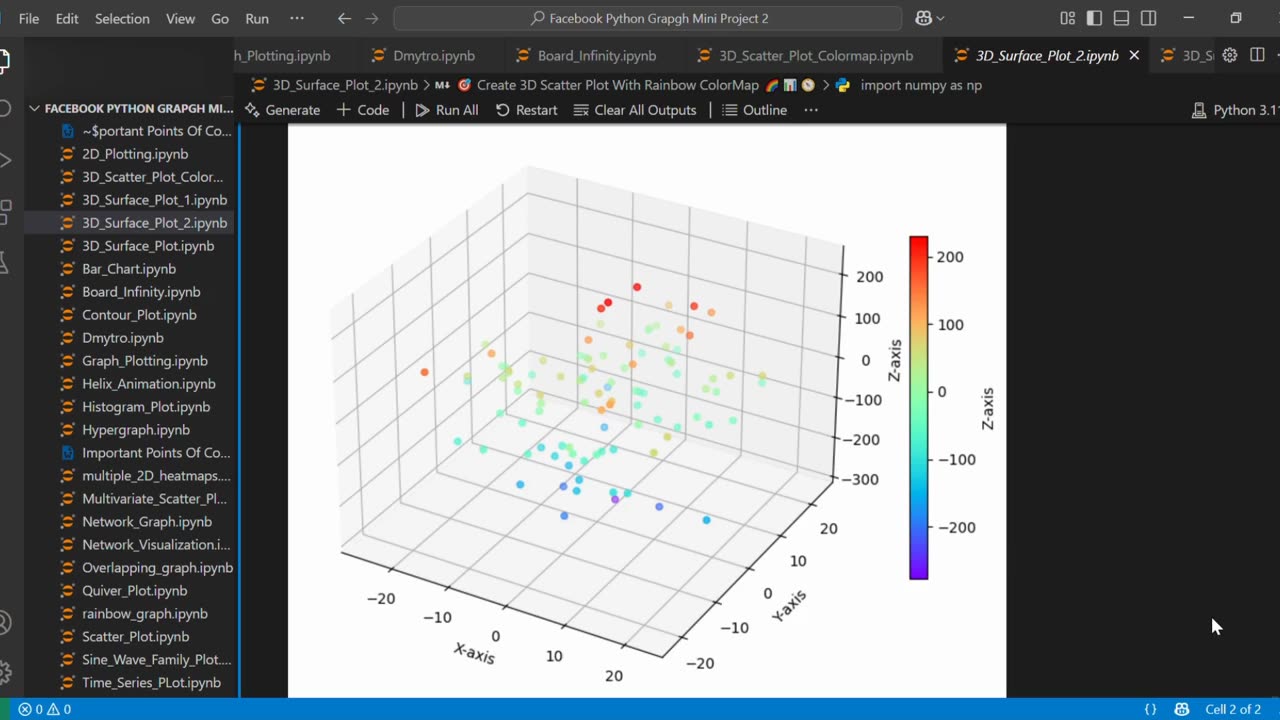
🎯 Create 3D Scatter Plot With Rainbow ColorMap 🌈📊🧭
Loading comments...
-
 1:15
1:15
AI Evolutionary Technology
15 days agoCreating a Stunning Peacock Tail Pattern with Python & Matplotlib
41 -
 1:55:33
Glenn Greenwald
5 hours agoDeceitful Hysteria over Tucker's Speech on Kirk; IDF Funder Larry Ellison to Take Over CBS, Paramount, and now TikTok; U.S. Embraces Leading Al-Qaeda Terrorist | SYSTEM UPDATE #519
133K36 -
 34:40
34:40
Donald Trump Jr.
6 hours agoWe Will Make Charlie Proud | TRIGGERED Ep.276
161K81 -
 1:01:49
BonginoReport
5 hours agoErika Kirk Forgives Charlie’s Assassin - Nightly Scroll w/ Hayley Caronia (Ep.139)
61.2K61 -
 LIVE
LIVE
megimu32
2 hours agoOn The Subject: Rush Hour | Would It Be Cancelled Today?
123 watching -
 1:24:12
Katie Miller Pod
4 hours ago $1.83 earnedEpisode 7 - Jillian Michaels | The Katie Miller Podcast
53.5K3 -
 LIVE
LIVE
LFA TV
1 day agoLFA TV ALL DAY STREAM ! | MONDAY 9/22/25
707 watching -
 1:02:10
LIVE WITH CHRIS'WORLD
4 hours agoLIVE WITH CHRIS'WORLD - Key Takeaways From Charlie Kirks Memorial
18.3K -
 1:37:17
Liberty Sentinel
6 days agoURGENT: Dr. Malone Warns of "Vaccine Cult" & Effort to "Fix God Gene" With Shots
14.2K8 -
 LIVE
LIVE
Rallied
5 hours ago $0.94 earnedHigh Octane Warzone Wins All Night
63 watching