Premium Only Content

What to Watch Update for Monday June 30, 2025
Link to The SPX Investing Program https://spxinvesting.substack.com
Link to The Daily Pivot Newsletter: https://thedailypivotnewsletter.substack.com/
Join to get access to perks:
https://www.youtube.com/channel/UCxlaGAKm2ApEs13O1gWDltg/join
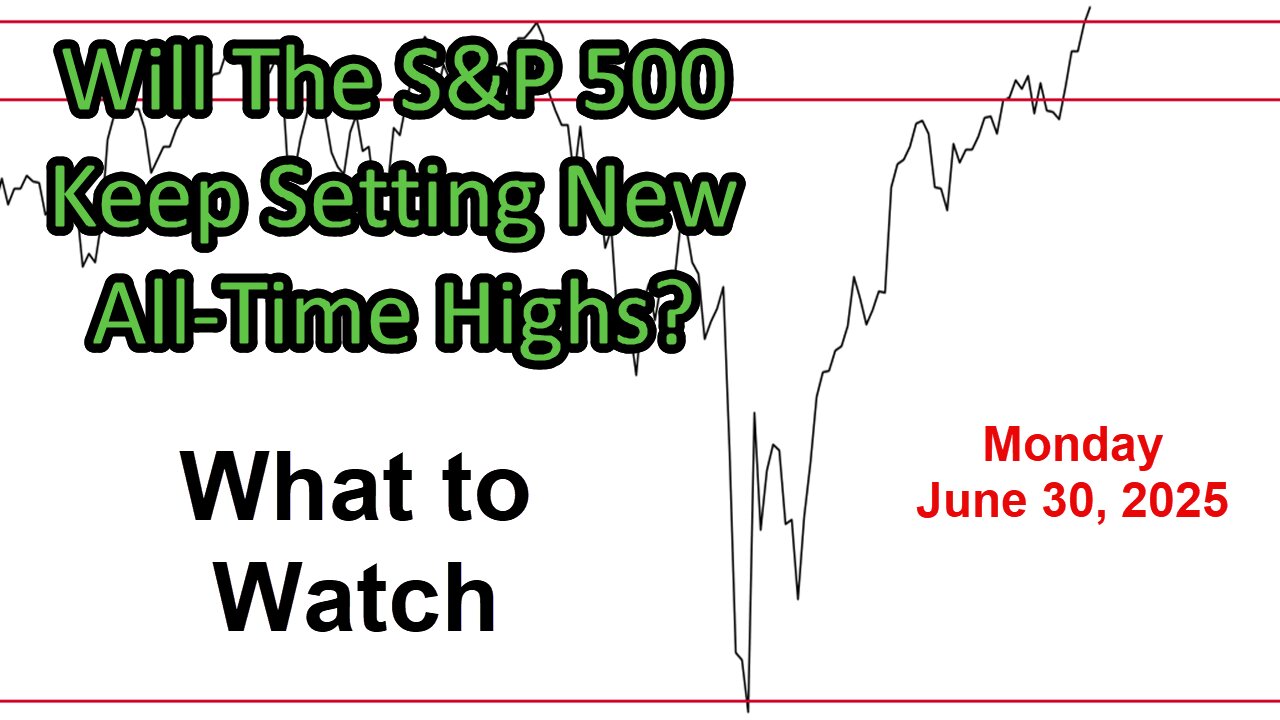
The What to Watch update analyzes daily and weekly charts to assess the S&P 500's current performance and potential future movements, especially after hitting a new all-time high on Friday. The analysis is divided into positive, negative, and watchlist factors, with a focus on whether the S&P 500 will continue setting new highs or face selling pressure as the new quarter begins after June 30.
Positive Factors:
Market Performance: The S&P 500 had an upward week, gapping higher on Tuesday and Friday, showing conviction to the upside. It surpassed the previous high from February 19, closing above it, indicating stronger momentum.
Seasonal Trends: Early July is historically a positive period, though seasonality is used only as a guide, not a decision-maker.
Technical Indicators:
Golden crosses in the NYSE and NASDAQ 100 suggest improving trends.
Growth stocks are outperforming value, with ratios such as the Qs to S&P and large-cap growth to value showing strength.
Cumulative advance-decline lines and volume-based indicators are hitting new highs, with volume leading price, which is often bullish.
The VIX is below 20 and declining, and risk-on-to-risk-off ratios are rising, signaling market optimism.
The McClellan Oscillator and summation indices are positive, and Bollinger Bands show an overbought but bullish breakout.
Smart money indicators (e.g., accumulation distribution, Chaikin money flow & oscillator) are advancing, and the vortex indicator is positive.
Sector Performance: Tech and semiconductors are setting new highs, with the FANG index and NASDAQ 100 showing strength. Financials are holding up well, and broad market measures such as the Wilshire 5000 and total US stock ETF are positive, with 70% of weightings outside tech, indicating broader participation.
Bond Market: Stocks are outperforming bonds (e.g., S&P 500 vs. 3-7 year bonds), suggesting expectations of a soft landing (no recession). TIPS ratios indicate low inflation concerns.
Negative Factors:
Volume Concerns: Volume has been below average, with spikes only on specific days (e.g., Friday). Lower volume on uptrends suggests a potential negative divergence.
Overbought Conditions: The S&P is overbought per the %B indicator and RSI (nearing 70), though this doesn’t guarantee an immediate reversal.
Limited SPX Participation: Only 55.2% of S&P stocks are above their 200-period moving average, indicating narrow participation driven by mega-cap and AI stocks.
Long-Term Oscillators: Indicators such as the Special K, TRIX, and KST remain negative, suggesting longer-term caution.
Equal Weight S&P: The equal-weight S&P and QQQ are not at all-time highs, unlike the weighted S&P, NDX and NASDAQ, indicating less broad market participation in the bigger indexes.
Home Construction: The home construction-to-bonds ratio is weak, reflecting interest rate sensitivity and underperformance since late 2024.
Watchlist Factors:
Employment Data: Initial jobless claims are declining, but continuing claims are rising, suggesting longer unemployment durations. The upcoming employment situation report on Thursday will be critical.
Volume Trends: Expect a volume spike on Monday due to quarter-end window dressing.
Yield Curves: The 10-year to 3-month yield curve is slightly inverted, raising potential recessionary concerns.
Sector Ratios: Discretionary (e.g., Tesla, Amazon) is improving but lagging. Retail and homebuilders are underperforming but stabilizing.
Global Markets: The German DAX is recovering, and US stocks may regain leadership if the S&P-to-DAX ratio keeps rising. Emerging markets are showing slight improvement.
Dollar and Oil: The US dollar is in a downtrend, potentially supporting stocks, while oil has dropped to the mid-60s, easing inflation fears.
Bellwether Industries: Semiconductors are stronger, but homebuilders, transports, retail, and regional banks need stronger uptrends for broader market confirmation.
Key Question:
Will the S&P 500 continue setting new all-time highs? The positive indicators (technical strength, sector performance, bond market signals) suggest potential for further gains, especially in early July, but negative divergences (volume, overbought conditions, limited participation) and watchlist items (employment, yield curves) warrant caution. The market is climbing a "wall of worry" amid geopolitical and tariff concerns but has shown resilience.
PDF of Slides:
https://drive.google.com/file/d/1CF55iT5GxQ1TOEAID_6ab4f5C9fMXY0j/view?usp=sharing
DISCLAIMER This video is for entertainment purposes only. I am not a financial adviser, and you should do your own research and go through your own thought process before investing in a position. Trading is risky!
-
 4:04
4:04
The SPX Investing Program
1 day agoDaily Update Podcast for Thursday September 25, 2025
17 -
 LIVE
LIVE
Dr Disrespect
5 hours ago🔴LIVE - DR DISRESPECT - ARENA BREAKOUT: INFINITE - STORM EVENT
2,170 watching -
 LIVE
LIVE
Barry Cunningham
6 hours agoPRESIDENT TRUMP SPEAKS ON JAMES COMEY INDICTMENT! MORE TO COME! DELICIOUS LIBERAL MELTDOWNS!
1,372 watching -
 25:59
25:59
Simply Bitcoin
1 day ago $0.63 earnedMichael Saylor Reveals $81T Bitcoin Plan to Cancel National Debt?!
9.44K5 -
 1:33:51
Steve-O's Wild Ride! Podcast
1 day ago $0.92 earnedJohn C. Reilly's Surprising Connection To Jackass (And Beef With Weeman!)
22.9K5 -
 LIVE
LIVE
StoneMountain64
3 hours agoBattlefield 6 News and Extraction Gaming
103 watching -
 2:13:30
Side Scrollers Podcast
6 hours agoUK Introduces MANDATORY Digital ID + Dallas ICE Shooting BLAMED on Gaming + More | Side Scrollers
85.8K8 -
 1:54:17
The Charlie Kirk Show
5 hours agoCharlie's Last Trip + What's Next + AMA | Erika Kirk, Mikey McCoy | 9.26.2025
272K240 -
 1:02:53
The Quartering
4 hours agoMAGA Kid Kidnapped, Hasan Piker Meltdown, Vivek Fights For Alex Jones & More
129K45 -
 32:49
32:49
Simply Bitcoin
1 day ago $1.83 earnedBitcoin Crucible w/ Alex Stanczyk | EP 1
36.4K