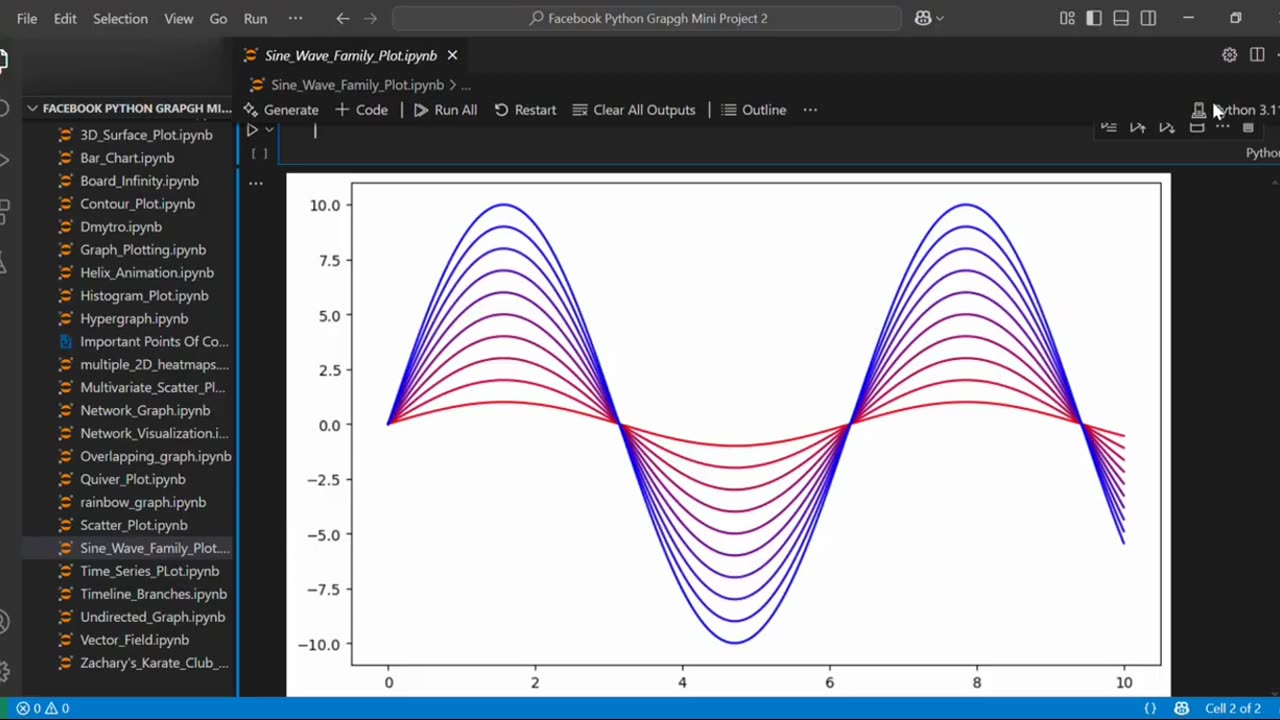
Create Rainbow Sine Wave Graph Using Python
Loading 1 comment...
-
 0:18
0:18
AI Evolutionary Technology
2 months ago💰 Simple Currency Converter App in Python
41 -

Timcast
1 hour agoViolence ERUPTS Over the Weekend, TERROR ATTACK In Australia
59.3K9 -
 LIVE
LIVE
Dr Disrespect
1 hour ago🔴LIVE - DR DISRESPECT - TERMINATOR 2D: NO FATE - FULL GAME
1,301 watching -

Steven Crowder
3 hours agoAustralia Shooting: It's not the Guns it's Islam
268K248 -
 LIVE
LIVE
Nerdrotic
2 hours agoNerdrotic Nooner 543
591 watching -
 LIVE
LIVE
Sean Unpaved
1 hour agoVikings ELIMINATE Cowboys From Playoff Contention | UNPAVED
69 watching -
 17:33
17:33
Cash Jordan
2 hours ago25,000 Homeless SEIZE NYC’s Subway… as “Communist Mayor” HANDS CITY to SQUATTERS
1173 -
 1:01:04
The Rubin Report
2 hours agoMSNOW Host Realizes Ilhan Omar Is a Monster After Her Australia Shooting Reaction
19.1K38 -

The Bubba Army
3 days ago"ROB REINER MURDERED" By His Own Son? - Bubba the Love Sponge® Show | 12/15/25
8.82K1 -
 17:09
17:09
Professor Nez
1 hour agoObama’s Operative Just Got HUMILIATED After Trying to IMPEACH America!
9.8K17