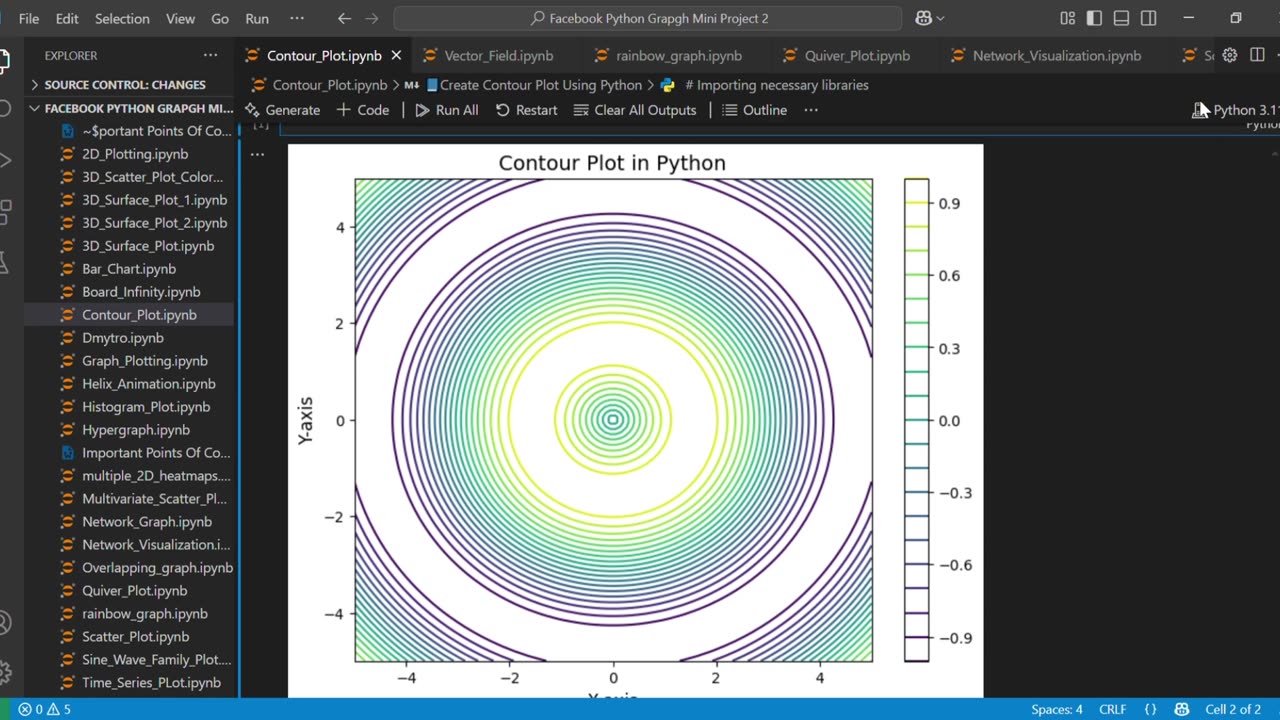
📘Create stunning Contour Plot Using Python
Loading comments...
-
 0:42
0:42
AI Evolutionary Technology
28 days agoGet Element Information Using Python 🧪
71 -
 2:04:27
TimcastIRL
9 hours agoDON LEMON ARRESTED | Timcast IRL #1439
283K98 -
 6:03:38
Drew Hernandez
1 day agoDON LEMON ARRESTED THEN RELEASED WITHOUT BAIL, HOMAN DRAW DOWN & NEW EPSTEIN FILES?
57.3K23 -
 13:56
13:56
Robbi On The Record
1 day ago $5.38 earnedWhy Everyone Is Deleting TikTok (billionaires, control & immigration)
53.1K18 -
 11:35
11:35
Dr. Nick Zyrowski
2 days agoHow To REVERSE Poor Eyesight ( Especially After 40 )
45.7K10 -
 59:06
59:06
The Rubin Report
13 hours agoPlan ₿ Forum El Salvador Day 1 Recap | Dave Rubin
141K7 -
 57:14
57:14
BonginoReport
12 hours agoDon Lemon ARRESTED: Why It Matters More Than You Think - Nightly Scroll w/ Hayley Caronia (Ep.225)
161K122 -
 11:08:58
Plan ₿ Forum
8 days agoPlan ₿ Forum El Salvador 2026 – Day 1 Live from the WAGMI Stage
266K17 -
 2:46:22
Laura Loomer
12 hours agoEP168: STAGED?! Ilhan Omar Uses Fake "Attack" To Cover Up Somali Fraud
84.2K41 -
 3:02:11
Nerdrotic
14 hours ago $9.92 earnedHollywood STRIKES Again?! | Star Trek Crash and Burn | Cancel Disney Plus - Friday Night Tights 391
114K12