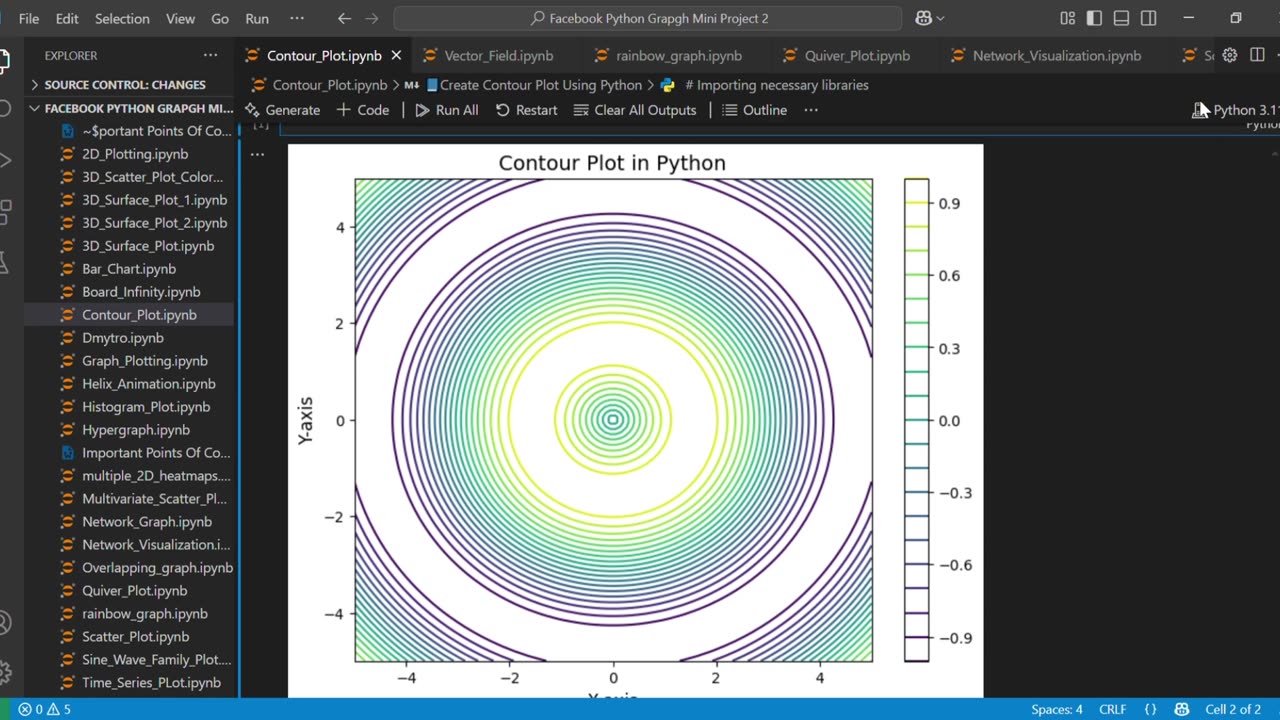
📘Create stunning Contour Plot Using Python
Loading comments...
-
 0:17
0:17
AI Evolutionary Technology
3 months agoVisualizing Molecular Structure From SMILES Using RDKit 🧪
6 -
 5:26:18
Akademiks
6 hours agoEbro has MELTDOWN after Drake tells him to *** SLOWLY! Radio Over? NLE vs Youngboy part 805?
17.6K -
 1:35:27
Inverted World Live
7 hours agoLost Satellites, Wild Horses, and 3i/Atlas
135K4 -
 2:53:42
TimcastIRL
5 hours agoCandace Owens IMPLODES, Audience IN REVOLT, Claim SHES A CLONE Or GOT THE CALL | Timcast IRL
273K200 -
 2:49:53
Barry Cunningham
6 hours agoLIVE BREAKING NEWS: President Trump Celebrates Hanukkah! And More News
53.5K10 -
 1:29:40
Anthony Rogers
13 hours agoEpisode 394 - Isaac Butterfield
18.9K1 -
 8:02
8:02
China Uncensored
11 hours agoChina Just Took The First Step Towards WAR
31.6K16 -
 1:20:04
Flyover Conservatives
1 day agoWhy Did Jesus Really Come? It’s NOT What You Think - Pedro Adao | FOC Show
30.9K2 -

DLDAfterDark
3 hours ago $2.55 earnedYo Homie! Is That My Briefcase?? EDC & Gun Talk - Blue Waffle Giveaway Pre Stream
29.1K2 -
 1:34:23
Glenn Greenwald
8 hours agoSydney Shooting Exploited for Pro-Israel Censorship and Anti-Muslim Crackdowns; How Media DEI Was the Opposite of Diversity | SYSTEM UPDATE #559
140K126