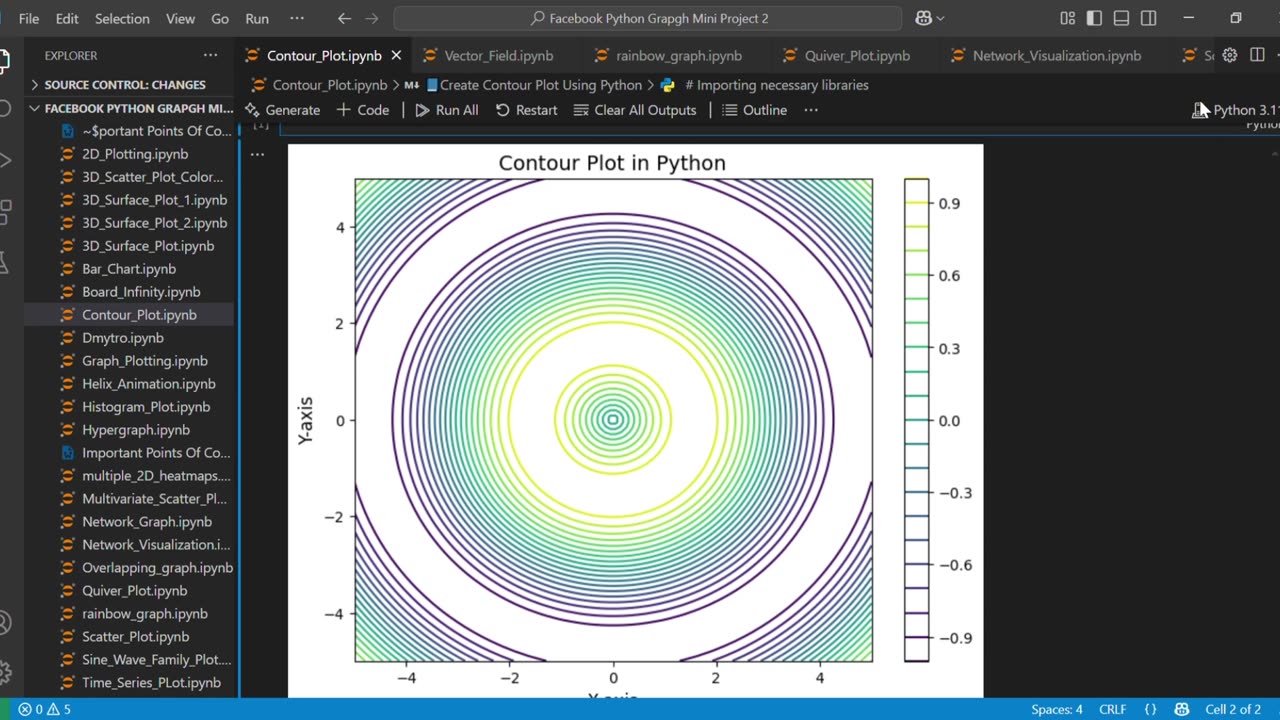
📘Create stunning Contour Plot Using Python
Loading comments...
-
 0:09
0:09
AI Evolutionary Technology
7 days agoCreate Customs Custom Heart ASCII Art Using Python
31 -
 2:07:44
TimcastIRL
2 hours agoTrump's Secret Plan To Make Charlie Kirk VP, America Fest IN CIVIL WAR | Timcast IRL
176K105 -
 LIVE
LIVE
I_Came_With_Fire_Podcast
11 hours agoLive Fire: Christmas Special
153 watching -
 46:26
46:26
Sarah Westall
5 hours agoWhat’s Behind the Silver Surge? Large Institutions Cashing In w/ Andy Schectman
12.9K -
 6:42:10
Turning Point USA
10 hours agoLIVE NOW: AMFEST DAY 2 - VIVEK, JACK POSOBIEC, MEGYN KELLY, ALEX CLARK AND MORE…
1.15M174 -
 LIVE
LIVE
Flyover Conservatives
21 hours agoHow to Win 2026 Before It Starts — Clay Clark’s Goal-Setting Blueprint | FOC Show
203 watching -
 12:52
12:52
The Kevin Trudeau Show Limitless
2 days agoBeyond Good And Bad: The Hidden Reality Code
34.6K18 -
 1:03:11
BonginoReport
6 hours agoBrown U Security Failures EXPOSED - Nightly Scroll w/ Hayley Caronia (Ep.201)
116K37 -
 51:09
51:09
Patriots With Grit
2 hours agoWill A.I. Replace Doctors? | Dr. Stella Immanuel MD
1.75K3 -
 4:10:32
Nerdrotic
7 hours ago $10.85 earnedHollywood's DOOMSDAY! WB FIRESALE! - Friday Night Tights 385 w Zachary Levi
71K14