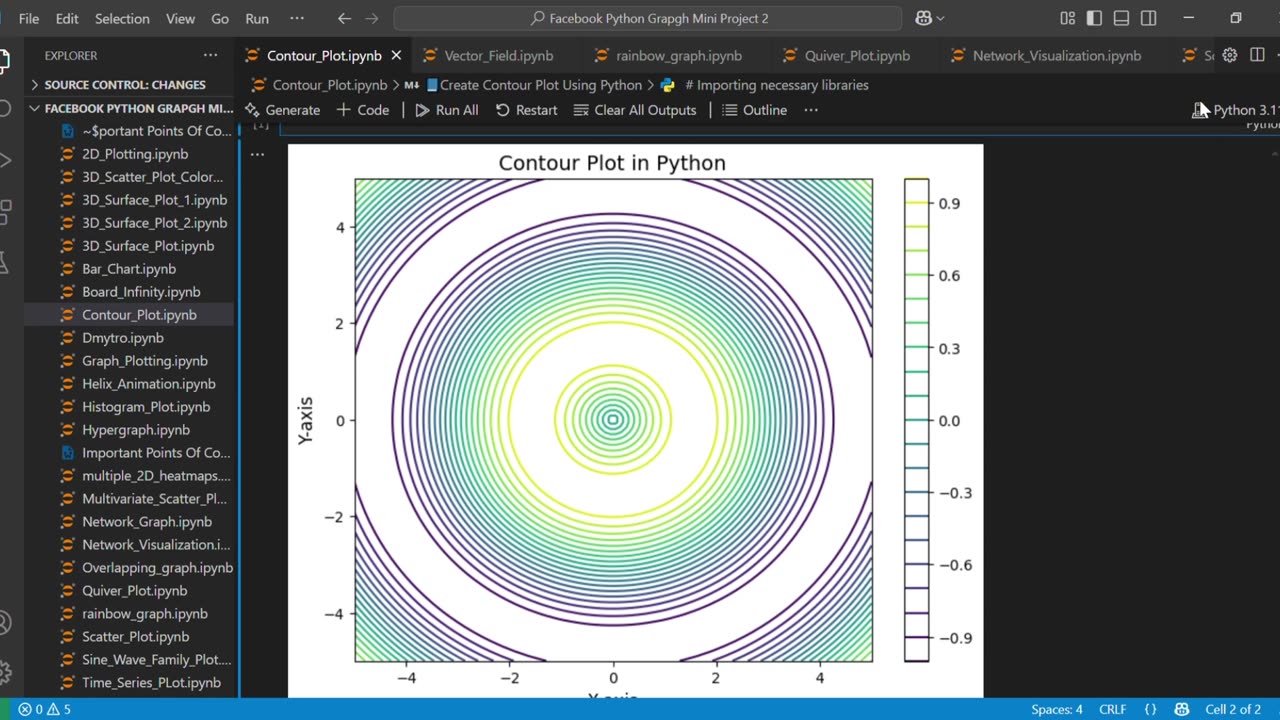
📘Create stunning Contour Plot Using Python
Loading comments...
-
 1:06
1:06
AI Evolutionary Technology
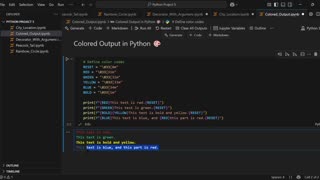
3 days agoAdd Stunning Colors to Your Python Console | Text Styling Made Easy
7 -
 LIVE
LIVE
BEK TV
2 days agoTrent Loos in the Morning - 9/15/2025
253 watching -
 LIVE
LIVE
The Bubba Army
2 days agoCharlie Kirk's Shooter, Had a Trans BF? - Bubba the Love Sponge® Show | 9/15/25
3,270 watching -
 3:38:49
Badlands Media
1 day agoThe Narrative Ep. 38: The Sovereign World
118K62 -
 2:57:44
The Charlie Kirk Show
13 hours agoWASHINGTON D.C. PRAYER VIGIL FOR CHARLIE KIRK
266K442 -
 14:11
14:11
Robbi On The Record
14 hours agoThe Trap of Identity Politics: How Division is Killing America
32.8K53 -
 1:29:23
Nerdrotic
14 hours ago $22.10 earnedThe Turning Point | New UFO Video with Michael Collins | Forbidden Frontier #117
95.9K29 -
 1:08:26
Sarah Westall
11 hours agoSuicide Pacts forming in Youth Social Media Groups - Discord, Reddit, TikTok w/ John Anthony
89.1K29 -
 2:25:31
vivafrei
22 hours agoEp. 281: Charlie Kirk; Routh Trial; Charlotte Train; Bolsanaro Defense; SCOTUS & MORE!
172K247 -
 2:55:38
Turning Point USA
13 hours agoWASHINGTON D.C. PRAYER VIGIL FOR CHARLIE KIRK
116K44