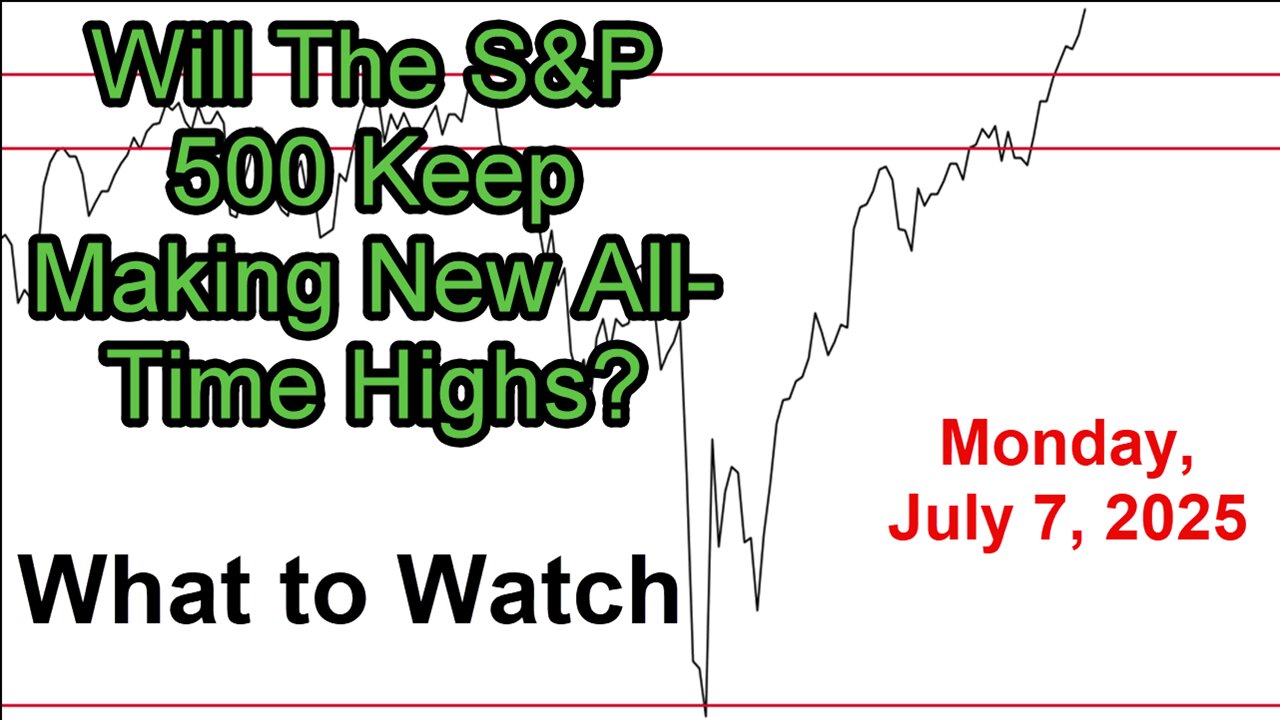
What to Watch Update for Monday July 7, 2025
Link to The SPX Investing Program https://spxinvesting.substack.com
Link to The Daily Pivot Newsletter: https://thedailypivotnewsletter.substack.com/
Join to get access to perks:
https://www.youtube.com/channel/UCxlaGAKm2ApEs13O1gWDltg/join
What to Watch Video Update Summary (July 7, 2025)
Overview: The update analyzes market trends, focusing on whether the S&P 500 will continue hitting all-time highs, with insights categorized into positive, negative, and areas to watch.
Positive Charts:
Market Performance: S&P 500 sustains all-time highs, bolstered by a strong employment report, closing near highs with dips being bought.
Sentiment & Momentum: Fear and Greed Index at 78 shows optimism, not yet signaling reversal. Market interprets news bullishly.
Technical Indicators: S&P 500 above 20-day MA since April, with bullish breakouts. Growth slightly outperforms value; golden cross in growth-to-value ratio.
High Beta & Risk-On: High beta stocks and risk-on ratios are rising, supporting bullishness.
Advance-Decline Lines: S&P and NYSE price/volume lines at all-time highs, showing broad strength.
Smart Money Indicators: Accumulation distribution, Chaikin Money Flow, and momentum indicators are positive but nearing extremes.
Sector Performance: Semiconductors, financials, and broad indices (e.g., Wilshire 5000) hit highs. Tech-to-utilities and stocks-to-bonds ratios favor growth.
NASDAQ, Small/Mid-Caps: NASDAQ 100 at highs with golden cross; small/mid-caps breaking above 200-day MA.
Negative Charts:
Overbought Concerns: S&P 500 at +4 standard deviation; McClellan Oscillator, RSI 9/14, and Bullish Percent Index at extremes, suggesting consolidation/pullback risk.
Longer-Term Indicators: Special K oscillator bearish on daily chart; TTM Squeeze monthly chart declining since late 2024; Mass Index weekly chart signals potential reversal (needs confirmation).
Home Construction vs. Bonds: Negative but slightly improving, sensitive to interest rates.
Areas to Watch:
Employment: Strong report reduces July Fed rate cut odds; continuing claims at 1.96M, nearing 2M concern threshold.
Volume: Below average due to holiday but rising in late June/early July; summer volume trends monitored.
Interest Rates: 10-year yield at 4.35%, nearing 4.5% where stocks may react negatively.
Bond Ratios: Cash-to-bonds and TIPS-to-bonds show no major inflation concerns but monitored daily.
Yield Curve: 10-year to 3-month spread at zero, fluctuating, with recession risk if inverted.
Junk Bonds: Declining spread vs. government bonds indicates reduced fear.
Oil Prices: Dropped to mid-60s after geopolitical spike; requires monitoring.
Global Markets: German DAX lags S&P 500; rising US-to-German stocks ratio suggests US leadership.
Retail & Bellwethers: Retail underperforms; semiconductors, home builders, transports, and regional banks show strength.
Gold & International: Declining gold-to-S&P ratio; US stocks outperforming international markets.
US Dollar: At 96.99, weaker dollar supports markets, but oversold condition may lead to rebound, pressuring stocks.
Key Question: Will S&P 500 continue all-time highs?
Outlook: Strongly bullish with broad participation, but overbought conditions and mixed longer-term signals (e.g., Special K, TTM Squeeze) suggest caution. Potential slowdown, consolidation, or pullback likely, though no immediate reversal confirmed.
PDF of Slides: https://drive.google.com/file/d/1tWQ7SvQGa1oj5YAHVzykjir9RgljwRIL/view?usp=sharing
DISCLAIMER This video is for entertainment purposes only. I am not a financial adviser, and you should do your own research and go through your own thought process before investing in a position. Trading is risky!
-
 29:18
29:18
The SPX Investing Program
6 hours agoInterMarket Analysis Update for Monday September 22, 2025
14 -
 38:21
38:21
Stephen Gardner
2 days ago🔥Is Kash Patel HIDING DETAILS About Charlie Kirk & Jeffrey Epstein? Judge Joe Brown
50.1K165 -
 26:33
26:33
DeVory Darkins
1 day ago $53.44 earnedRep Omar EMBARRASSES herself in a painful way as Newsom PANICS over Kamala confrontation
84.1K302 -
 3:28:14
Badlands Media
1 day agoThe Narrative Ep. 39: The Sovereign Mind
112K38 -
 2:17:35
TheSaltyCracker
10 hours agoThe Charlie Kirk Effect ReeEEStream 9-21-25
122K326 -
 2:03:07
vivafrei
10 hours agoEp. 283: Charlie Kirk Memorial and other Stuff in the Law World
221K185 -
 9:13:12
The Charlie Kirk Show
21 hours agoLIVE NOW: Building A Legacy, Remembering Charlie Kirk
2.17M949 -
 1:55:20
The White House
13 hours agoPresident Trump Participates in the Memorial Service for Charlie Kirk
108K95 -
 1:02:41
Sarah Westall
12 hours agoDomestic Terror Operation: Death Threats, Smear Campaigns, Gang Stalking w/ Journalist Sarah Fields
60.1K10 -
 1:51:40
Nerdrotic
12 hours ago $22.72 earnedGobekli Tepe Discovery and "Reconstruction" | Forbidden Frontier #118
97.7K10