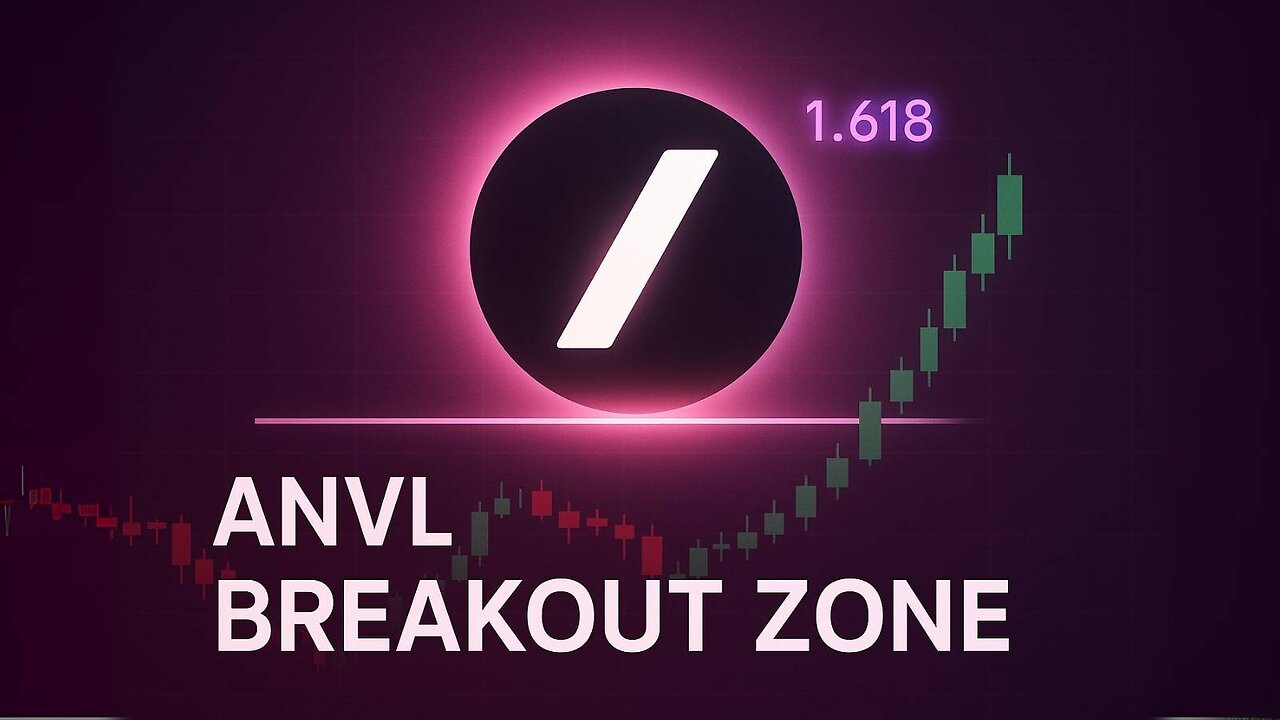
ANVL Set for a Big Move? 📈 Key Chart Patterns & Fibonacci Levels Explained
Anvil (ANVL) is flashing signs of momentum—and in this technical analysis breakdown, we highlight the key price zones, Fibonacci levels, and chart structures that could signal a breakout or breakdown. If you're tracking this low-cap crypto, this is a must-watch.
📅 Originally streamed live on July 15, 2025
📺 Full episode here: https://www.youtube.com/live/qBSg3wF6jt8?si=QPBtWXiqT_xkgg7d
What’s covered in this ANVL chart analysis:
ANVL/USDT monthly chart
Key support & resistance zones
Fibonacci retracement breakdown
Candlestick momentum analysis
What to watch for next: breakout or rejection
Market sentiment and future outlook
🎙️ Technical analysis by Crypto Papi (Twitter: @cryptopapi_mike)
🎥 Hosted by Butter Smooth Crypto
⏱️ Timestamps:
00:00 – Welcome Back: Anvil (ANVL) on the Radar
00:22 – Monthly Chart Structure Overview
01:05 – Key Fibonacci Levels & Breakout Zones
02:15 – Recent Momentum & Candlestick Breakdown
03:45 – What Needs to Happen Next for ANVL
04:30 – Final Thoughts & Price Target Watch
👇 Stay connected for more real crypto analysis:
Twitter: @jjbuttersmooth
Instagram: @buttersmoothcrypto
👍 Like this breakdown if you're watching ANVL closely
💬 Drop your ANVL price prediction in the comments
👀 Follow us on Rumble for weekly technical analysis, altcoin spotlights, and price target breakdowns
-
 LIVE
LIVE
Darkhorse Podcast
2 hours agoThe 295th Evolutionary Lens with Bret Weinstein and Heather Heying
584 watching -
 1:11:51
Russell Brand
3 hours agoCharlie Kirk Murder Suspect Faces DEATH PENALTY, As Media Creates Love Story Narrative - SF635
180K67 -
 LIVE
LIVE
Jeff Ahern
1 hour agoNever Woke Wednesday with Jeff Ahern
135 watching -
 2:00:54
The Charlie Kirk Show
3 hours agoGlenn Beck Commemorates Charlie Kirk | 9.17.2025
254K155 -
 29:55
29:55
Neil McCoy-Ward
2 hours agoMASSIVE Military Movement (Things Are Heating Up FAST...)
6.75K6 -
 40:00
40:00
The Kevin Trudeau Show Limitless
5 hours agoYour Wish Is Your Command: The Missing Secrets of Manifesting
8.48K1 -
 37:18
37:18
The White House
3 hours agoVice President JD Vance Delivers Remarks on President Trump’s Tax Cuts
25.7K18 -
 1:13:10
Sean Unpaved
3 hours agoKawhi's Payday Peril, MLB's October Odyssey, & Raleigh's Switch-Hit Throne
31.5K -
 1:39:16
Steven Crowder
6 hours agoJimmy Kimmel & The Left Desperately Want to Gaslight America - Don't Let Them
517K452 -
 2:33:06
The Shannon Joy Show
5 hours agoFinal Betrayal: Trump’s FBI Director Kash Patel Declares Jeffrey Epstein WASN’T A Sex Trafficker.
47.4K61