Is SHIB Ready for a Move, or Just Another Meme Bounce?
OOOPss, I am not technical trade advisor of any kind, just showing you how i trade!!!! A. Standard Technical Analysis (TA) — SHIB/USDT
Trend:
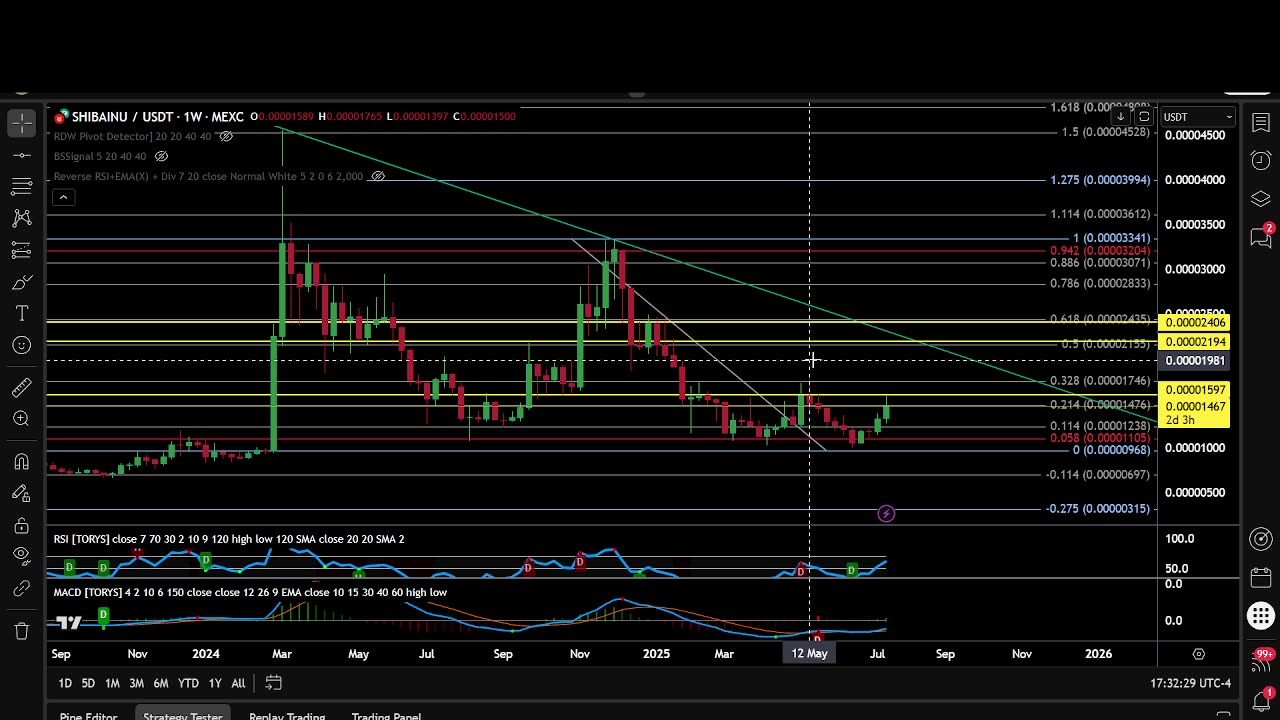
SHIB has been consolidating in a wide range since its 2021 “meme coin” peak. The current price is up 0.69% on the day, but still far below all-time highs.
Support/Resistance:
Support: 0.00001200, 0.00001000
Resistance: 0.00001500, 0.00001850
Momentum:
Modest daily uptick (+0.69%) suggests weak, range-bound trading. No obvious trend; momentum indicators (like RSI/MACD) are likely neutral.
Summary:
SHIB remains a highly speculative, low-price coin. Traders look for breakouts above 0.00001500 for bullish momentum, or breakdowns below 0.00001200 for bear confirmation. Until then, expect choppy, sideways action.
B. Stringent PureLogic Analysis — SHIB/USDT
Title:
Is SHIB Ready for a Move, or Just Another Meme Bounce?
Introduction:
Shiba Inu (SHIB) is trading at 0.00001456 USDT, up slightly for the day, but with little volume. The market seeks direction: meme resurgence or more drift?
Background & Context:
Meme Status:
SHIB’s price action is driven by social sentiment, major exchange listings, and broader meme-coin cycles (usually in sync with DOGE).
All-Time High:
Far below the 2021 peak, with multiple “dead cat bounces” since.
Technical Breakdown:
1. Price Structure:
Macro:
Multi-month sideways action, with failed rallies at 0.00001850 and support forming above 0.00001000.
Current Level:
0.00001456 is just below the resistance at 0.00001500. Previous attempts to break higher have failed without a major meme catalyst.
2. Momentum:
Volume:
No significant surge; suggests retail boredom or lack of big whales entering.
RSI:
Likely in the 45–55 range — neither overbought nor oversold. No signal of a strong trend developing.
MACD:
Most likely flat, consistent with a consolidating market.
3. Pattern:
Breakout/Breakdown Risk:
A break and hold above 0.00001500, on volume, could bring a quick push to 0.00001850 or higher (as meme coins move in fast bursts).
Failure here and a loss of 0.00001200 could trigger a slide toward 0.00001000 or lower.
“Meme Cycles”:
Any sudden social or Elon-related event can override all technical signals.
-
 LIVE
LIVE
Side Scrollers Podcast
1 hour agoAsmongold/DSP RESPONSE + Kaceytron’s Life IMPLODES + Lunduke Gets Threats + More | Side Scrollers
7,761 watching -
 29:48
29:48
The White House
1 hour agoPresident Trump and The First Lady Participate in the Thanksgiving Turkey Pardoning
2 -
 LIVE
LIVE
Steven Crowder
3 hours ago🔴Donald Vs. Ilhan: Trump Boots Somalis and The Meltdown is Glorious
23,643 watching -
 LIVE
LIVE
The Charlie Kirk Show
41 minutes agoMark Kelly Court Martial + AI Embargo + Thanksgiving | Davis, Federer, Newcombe | 11.25.2025
2,696 watching -
 53:20
53:20
The Rubin Report
1 hour agoLara Trump Destroys Bill Maher’s Narrative w/ Facts in 1 Minute
13.8K16 -
 LIVE
LIVE
LFA TV
14 hours agoLIVE & BREAKING NEWS! | TUESDAY 11/25/25
3,944 watching -
 1:08:44
VINCE
4 hours agoThe Deep State Strikes Back! (Guest Host Shawn Farash) | Episode 176 - 11/25/25 VINCE
179K98 -
 DVR
DVR
Benny Johnson
2 hours agoIt's All True, The 2024 Election Was Ready To Be Rigged. The REAL Story of How Trump-Elon STOPPED It
46.3K48 -
 LIVE
LIVE
The Mel K Show
1 hour agoMORNINGS WITH MEL K - A Republic.. If You Can Keep It! 11-25-25
806 watching -
 LIVE
LIVE
The Shannon Joy Show
1 hour agoDOGE Is DEAD * Trump’s Golden Economy Implodes * LIVE Exclusive With Galileyo CEO Brett Miller
179 watching