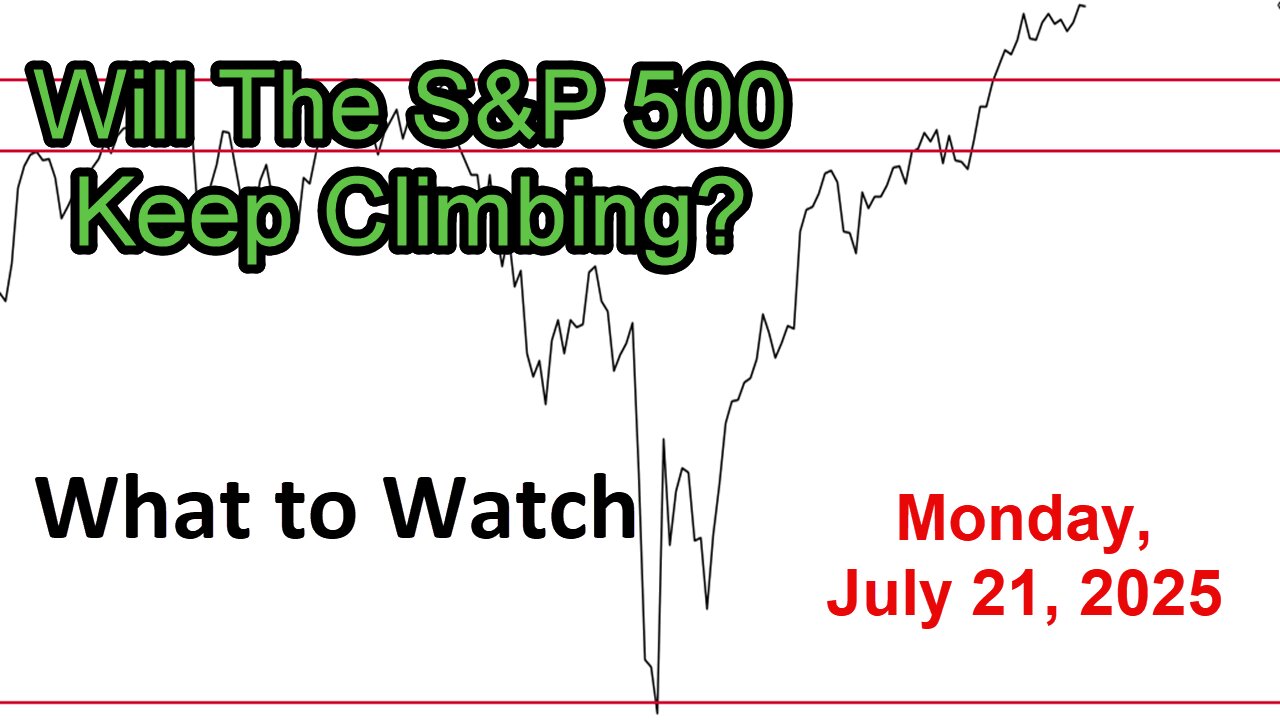
What to Watch Update for Monday July 21, 2025
Link to The SPX Investing Program https://spxinvesting.substack.com
Link to The Daily Pivot Newsletter: https://thedailypivotnewsletter.substack.com/
Join to get access to perks:
https://www.youtube.com/channel/UCxlaGAKm2ApEs13O1gWDltg/join
Summary of What to Watch Video Update (Prepared for July 21, 2025)
This video update analyzes market trends for the S&P 500, categorizing indicators into positive, negative, and areas to monitor. Here's a concise summary:
Positive Indicators:
S&P 500 Trend: The S&P 500 is in an uptrend, staying above the 20-period moving average, with a constructive daily chart. Despite a mid-week dip due to news (e.g., Trump-Powell speculation), it recovered, closing slightly positive.
Growth vs. Value: Growth-to-value ratios (large, mid, small caps) are positive, with growth outperforming value. The blue line (growth) remains above the red line (value) intraday.
Sector Performance: Discretionary stocks are improving, outperforming defensive staples. Tech and semiconductors are strong, with the NASDAQ 100 and semiconductor ETFs setting recent all-time highs.
Risk Indicators: VIX below 20 signals positive annualized returns. Risk-on to risk-off and high-beta to low-beta ratios are rising, favoring bullish sentiment.
Advance-Decline Lines: Volume-based advance-decline lines are strong, and the NYSE, mid, and small-cap advance-decline lines remain above moving averages.
Smart Money Indicators: Modified MACD (Boom Indicator) and Chaikin Money Flow are positive, with short-term trends strengthening (green line above red line).
Bond Ratios: S&P 500 outperforming bonds (3-7 year), indicating a soft-landing expectation. Tech and NASDAQ 100 also outperforming bonds, reinforcing bullish sentiment.
Financial Sector: Holding up well despite some selling post-earnings.
Negative Indicators:
Momentum Slowdown: Short and intermediate-term oscillators (e.g., MACD, PMO, PPO, TSI, KST) are rolling over or flattening, reflecting recent sideways action.
Smart Money Indicator #3: Chaiken Oscillator dropped below the moving average, signaling short-term weakness.
McClellan Oscillators: Both S&P and NYSE oscillators are below zero, indicating declining momentum in price and volume.
Bullish Percent Index: Declining despite high readings, showing negative divergence.
Mass Index (Weekly): Triggered a potential reversal signal after crossing below the red dashed line.
Financials Underperformance: Financials are underperforming the S&P 500, with the ratio dropping below the 200-day moving average.
Zahorchak Method: Shifted to a full sell signal (-10) on a long-term basis.
Home Construction: Struggling compared to bonds, not yet turning positive.
Areas to Monitor:
Seasonal Weakness: Mid-July to October has seen declines over the last two years, raising caution for potential pullbacks (2-10%).
Volume: Below average, typical for summer, but a concern if it persists.
Sentiment: Exuberant at a 75 reading, suggesting a possible contrarian indicator if it remains extreme.
Pivot Points: Long-Term overhead resistance at 6468 (R1) for the S&P 500 and NASDAQ’s R1 level.
Jobless Claims: Initial claims are stable, but rising continuing claims could signal prolonged unemployment.
Bond Yields & Inflation: 10-year bond yields (US and Japan) and TIPS ratios are being watched for inflation concerns. CPI came in hotter than expected, while PPI was weaker.
Retail Sales: Stable but underperforming the S&P 500, indicating relative weakness.
Key Ratios: Discretionary-to-staples, tech-to-utilities, and biotech-to-healthcare ratios are positive but show slight weaknesses (e.g., hotels-to-utilities).
Bellwether Industries: Semiconductors and home builders are solid, but transports and regional banks are weakening or sideways.
Global Markets: The German DAX is in an uptrend, but US stocks are not leading international markets. Emerging markets show slight improvement but no breakout.
Dollar and Gold: A weaker dollar supports stocks, while gold-to-S&P ratio remains below a declining trendline.
Inflation Expectations: Rising CRB index and oil prices (geopolitical) warrant attention.
Key Question:
Will the S&P 500 keep climbing? The market is positive but shows vulnerabilities (e.g., negative divergences, seasonal risks, and high sentiment). A 2-10% pullback is possible but could be normal within the uptrend. Daily videos will track shifts in sentiment and momentum.
PDF of Slides:
https://drive.google.com/file/d/14MlMBqoF7YMW-JQxVnflib2AXVn1LbbM/view?usp=sharing
DISCLAIMER This video is for entertainment purposes only. I am not a financial adviser, and you should do your own research and go through your own thought process before investing in a position. Trading is risky!
-
 4:36
4:36
The SPX Investing Program
3 days agoDaily Update Podcast for Tuesday September 30, 2025
14 -
 41:36
41:36
MattMorseTV
2 hours ago $4.46 earned🔴Portland just made a BIG MISTAKE.🔴
8.7K30 -
 LIVE
LIVE
LFA TV
22 hours agoLIVE & BREAKING NEWS! | FRIDAY 10/3/25
609 watching -
 4:07:27
Nerdrotic
6 hours ago $6.83 earnedHollywood is TARIFFied, James Gunn Attacks Fans, Bill Burqa, RoP is Doomed | Friday Night Tights 374
47.9K6 -
 LIVE
LIVE
Eternal_Spartan
10 hours ago🟢 Eternal Spartan Plays Destiny 2 | The Best PVP/PVE Action!| USMC Veteran
34 watching -
 LIVE
LIVE
Jorba4
1 hour ago🔴Live-Jorba4- Borderlands 4
15 watching -
 1:06:26
BonginoReport
5 hours agoPortland Protesters Plan Nude Bike Ride To Own Trump - Nightly Scroll w/ Hayley Caronia (Ep.148)
73.8K75 -
 1:30:43
The Mike Schwartz Show
3 hours agoTHE MIKE SCHWARTZ SHOW Evening Edtion 10-03-2025
13.4K5 -
 1:47:22
iCkEdMeL
4 hours ago $2.29 earnedFlag Burning, Antifa & Arrest: Journalist Nick Sortor Detained in Portland Chaos
19.2K9 -
 1:39:27
Roseanne Barr
6 hours agoThe Dragon’s Prophecy W/ Dinesh D’Souza | The Roseanne Barr Podcast #118
124K59
