🚨 Ethereum Breakdown Alert! Rising Wedge Cracks – Is $3,450 the Final Support?
4 months ago
26
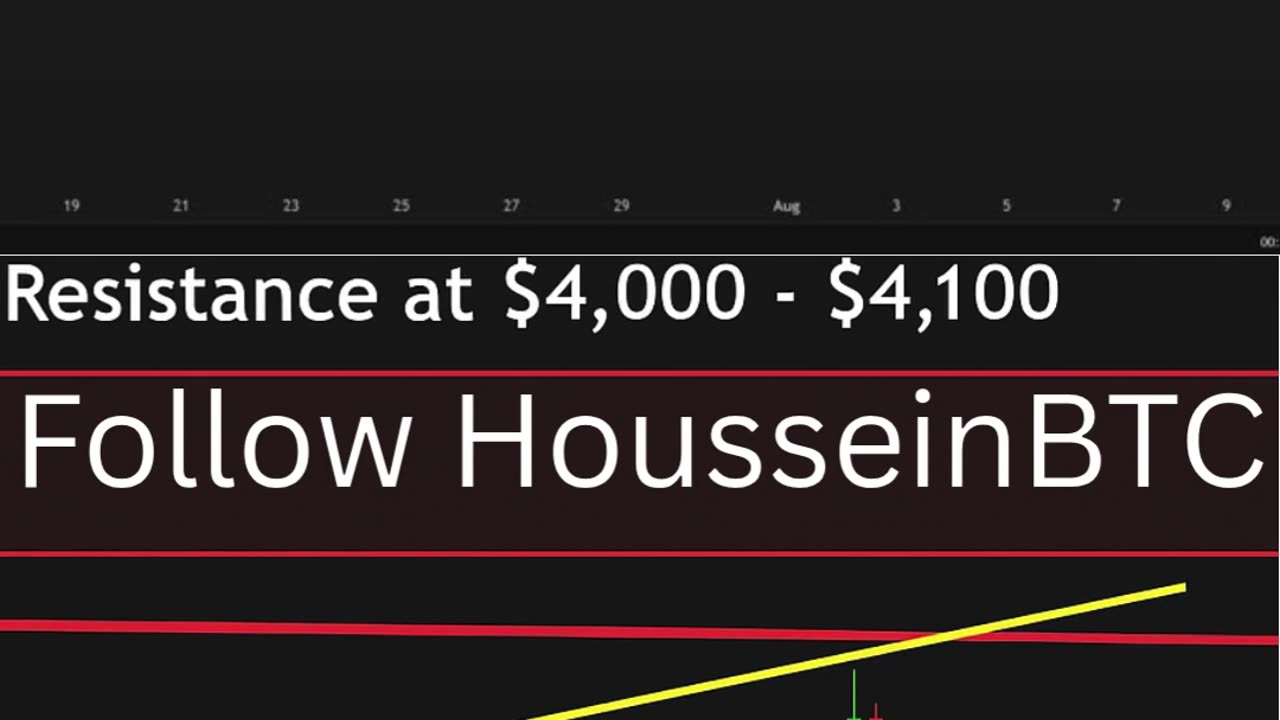
Ethereum (#ETH) just broke down from a rising wedge pattern on the 4-hour chart — a classic bearish signal in technical analysis. This could trigger a pullback toward the key support zone at $3,450 before any potential bounce. With resistance looming at $4,000–$4,100, traders should watch price action closely.
Is this a healthy correction or a deeper retracement? In this video, we break down the chart, highlight critical zones, and explore possible Ethereum price targets and entry points.
👉 Perfect for crypto traders, Ethereum investors, and technical analysts looking to stay ahead of the next big move!
Loading 1 comment...
-
 LIVE
LIVE
Adam Does Movies
5 hours agoTalking Movies + Ask Me Anything - LIVE
112 watching -
 2:12:14
TheSaltyCracker
3 hours agoWar Crimes ReeEEStream 12-03-25
54.8K116 -
 1:31:59
Glenn Greenwald
4 hours agoTrump Administration Claims to Save Hundreds of Millions of Lives by Blowing Up Drug Boats; Ethan Klein's Unhinged Vengeance & Lawsuits Against Other YouTubers: With Taylor Lorenz | SYSTEM UPDATE #553
93.1K113 -
 19:14
19:14
MetatronCore
20 hours agoHow Propaganda works on your Brain
10.2K3 -
 1:26:32
Joker Effect
2 hours agoWHO IS TYSON HOCKLEY?! What does the IRL streaming space look like? WHY IS EVERYONE SUEING EACHOTHER
3.29K -
 2:48:40
Barry Cunningham
5 hours agoLIVE BREAKING NEWS: Erika Kirk and TPUSA Have Had It With Candace Owens | Where Are The Children?
47.8K58 -
 15:30
15:30
IsaacButterfield
18 hours ago $0.01 earnedViolent Immigrant Crime Is Exploding in Australia
9.42K16 -
 8:37
8:37
DBoss_Firearms
9 hours ago $0.01 earnedHow hard is it to shoot with a G-Flex Trigger?
6.79K -
 1:05:17
BonginoReport
6 hours agoWhite House Claps Back At Sabrina Carpenter - Nightly Scroll w/ Hayley Caronia (Ep.189)
118K30 -
 1:06:50
TheCrucible
6 hours agoThe Extravaganza! EP: 69 (12/03/25)
84.5K18