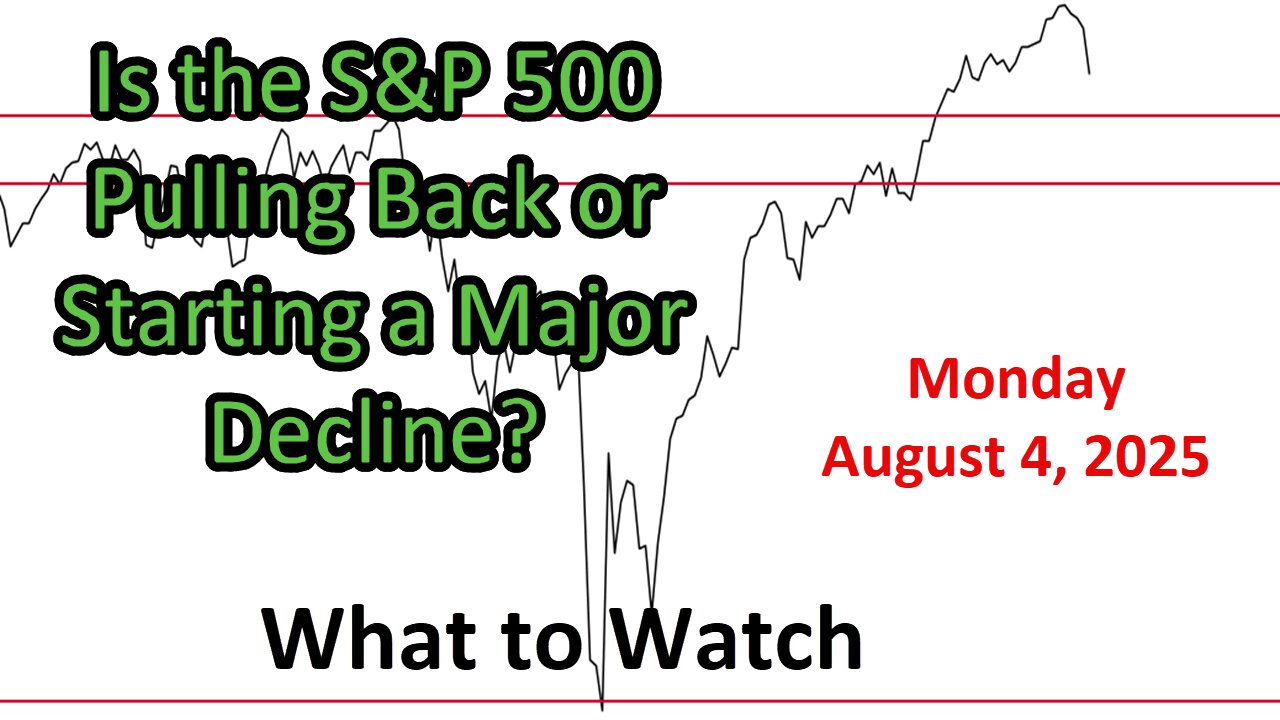
What to Watch Update for Monday August 4, 2025
Link to The SPX Investing Program https://spxinvesting.substack.com
Link to The Daily Pivot Newsletter: https://thedailypivotnewsletter.substack.com/
Join to get access to perks:
https://www.youtube.com/channel/UCxlaGAKm2ApEs13O1gWDltg/join
Summary of "What to Watch" Video Update for August 4, 2025
The video provides a technical analysis update on the stock market, focusing on the S&P 500, and categorizes charts into three groups: positive, negative, and areas to watch. The key question: Is the S&P 500 is experiencing a pullback or the start of a major decline?
Positive Indicators:
S&P 500 Uptrend: Despite a pullback, the S&P 500 remains in an uptrend, holding above the 30-period exponential moving average and near a pivot point support level.
Intermediate Trend: The 50-period moving average shows the intermediate trend is still positive, with lines not rolling over slightly.
Landry Light & Proper Order: Both remain green, indicating sustained upward momentum despite recent declines.
Point and Figure Chart: Weekly chart shows a new "X," signaling continued upward movement from a June breakout.
Growth vs. Value Ratios: Large-cap, mid-cap, and small-cap growth-to-value ratios are still in uptrends.
Sector Performance: Discretionary-to-staples and tech-to-staples ratios remain positive, with tech outperforming staples. Large and mid-caps are above moving averages.
Stock-to-Bond Ratios: Ratios such as QQQ-to-S&P and tech-to-bonds are leveling but still positive, suggesting a market expectation of a soft landing (no recession).
Other Indices: The Dow, NASDAQ, NASDAQ 100, and Wilshire 5000 remain in uptrends, with recent golden crosses in some cases. Semiconductors and FAANG indices are also positive despite pullbacks.
Negative Indicators:
Short-Term Trend: The S&P 500 is below the 20-period moving average, with short-term indicators including the advance-decline oscillator and TTM squeeze turning negative.
VIX Surge: The VIX is above 20, signaling increased volatility and historically negative annualized returns. RSI on the VIX shows a strengthening move upward.
Smart Money Indicators: Accumulation/distribution, Chaikin Money Flow, and Chaikin Oscillator are negative, indicating weakening buying pressure.
Divergences: Negative divergences in the McClellan Oscillator, NYSE summation index, and other momentum indicators suggest exhaustion as the S&P made higher highs.
Daily Point and Figure: Recent "O" additions reflect Friday’s decline, contrasting with the positive weekly chart.
Bullish Percent Index: Dropping below 50 for the NASDAQ 100 and declining for the SPX and NYSE, signaling reduced bullish sentiment.
Financials vs. S&P Ratio: The ratio is below the 200-day moving average, with a potential death cross forming.
Long-Term Signals: The NYSE Zahorchak method indicates a long-term sell signal.
Areas to Watch:
Employment Data: A weaker-than-expected employment report (unemployment at 4.2%) and new tariffs contributed to Friday’s decline, with futures already down pre-report.
Volume and Volatility: Volume spiked on Thursday but dropped on Friday. The SKU index suggests the market expects a significant move, direction unclear.
Bond Yields: The 10-year yield dropped significantly, and the 10-year to 3-month yield curve is inverted again, raising recession concerns. However, risky vs. less risky bond spreads show low fear.
Sector Ratios: Discretionary-to-staples (equal weight) and tech-to-utilities ratios are weakening, while biotech-to-healthcare and hotels-to-utilities are declining.
Bellwether Sectors: Semiconductors pulled back, transports and retail weakened, and regional banks show signs of faltering. Homebuilders held up due to lower interest rates.
Commodities and Global Markets: Oil remains in the mid-60s (geopolitical influence), gold-to-SPY ratio is stable but could spike, and U.S. stocks outperforming international markets (e.g., German DAX) recently. The dollar briefly broke above 100 but fell back to 98.
Conclusion:
The S&P 500 shows a mixed picture, with short-term indicators turning negative due to Friday’s decline, driven by weak employment data and tariff concerns. However, intermediate and long-term trends remain positive, supported by uptrends in key indices and growth-to-value ratios. The market anticipates a soft landing, but increased volatility (VIX above 20) and negative divergences warrant caution. Key areas to monitor include employment, bond yields, sector performance, and global market trends to determine if this is a temporary pullback or the start of a major decline.
PDF of Slides:
https://drive.google.com/file/d/1OqDsHPrhO_MscVBLo7_bjLE-_zrCaUjX/view?usp=sharing
DISCLAIMER This video is for entertainment purposes only. I am not a financial adviser, and you should do your own research and go through your own thought process before investing in a position. Trading is risky!
-
 32:40
32:40
The SPX Investing Program
9 hours agoS&P 500 Daily Update for Wednesday September 24, 2025
25 -
 55:40
55:40
TheSaltyCracker
4 hours agoIdiots Chug Tylenol PT2 ReeEEStream 9-24-25
80.1K206 -
 LIVE
LIVE
Akademiks
5 hours agoYoung Thug Dissing YFN Lucci. Ready to Go back to Jail. Offset vs Cardi b
1,142 watching -
 7:07
7:07
Colion Noir
13 hours agoCalifornia Just Banned All Glocks
38.4K34 -

Adam Does Movies
6 hours ago $0.90 earnedTalking Movies + Ask Me Anything - LIVE
29.6K1 -
 1:23:56
Jamie Kennedy
4 hours agoChoosing Good in a World Gone Dark | Ep 223 HTBITY with Jamie Kennedy
27.3K6 -
 DVR
DVR
SpartakusLIVE
8 hours ago#1 Challenge CHAMPION of WZ || Ridin' The GRAVY Train w/ GloryJean
68.5K1 -

The Pascal Show
3 hours ago $1.09 earnedDISTURBING UPDATES! New Developments In The D4vd Celeste Case... Possible Celeste Sighting?!
25.8K2 -
 2:03:18
The Charlie Kirk Show
6 hours agoTPUSA Presents This is The Turning Point Tour LIVE with Megyn Kelly and Governor Glenn Youngkin!!
229K66 -
 1:37:35
Badlands Media
22 hours agoAltered State S3 Ep. 47: Epstein, DOJ Whistleblowers, and Trump’s Tightrope
47.5K8