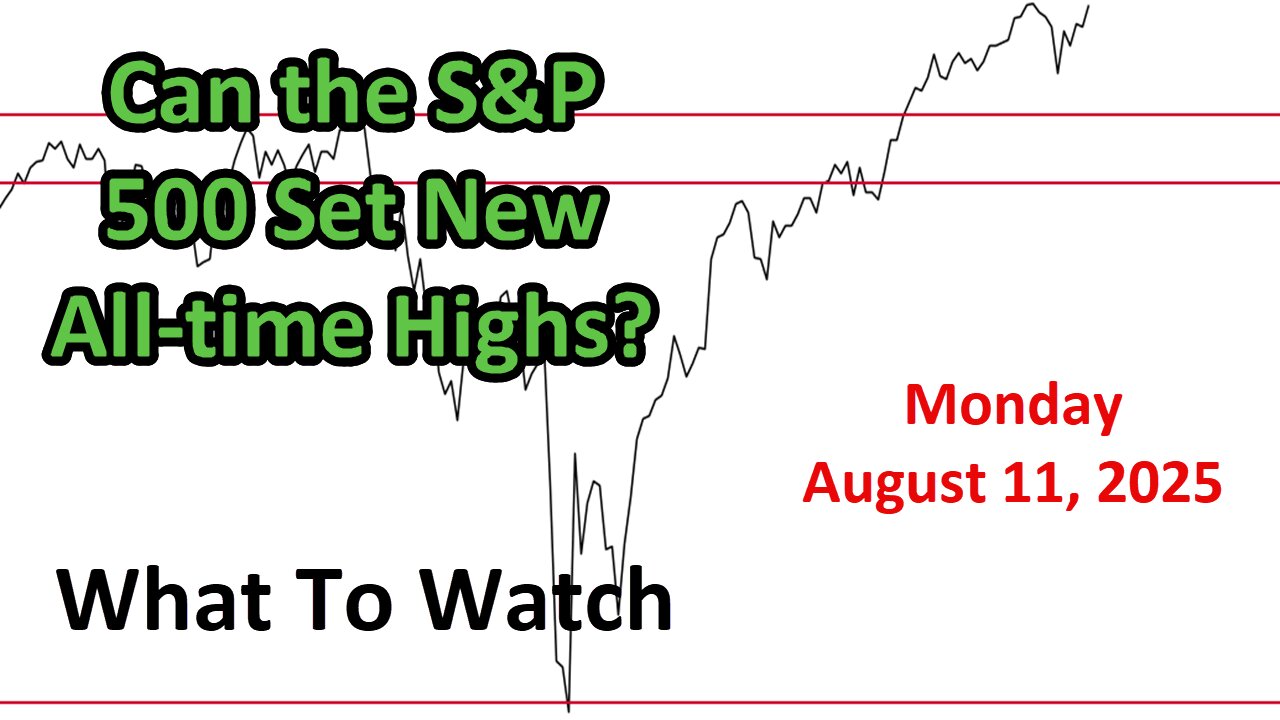
What to Watch Update for Monday August 11, 2025
Link to The SPX Investing Program https://spxinvesting.substack.com
Link to The Daily Pivot Newsletter: https://thedailypivotnewsletter.substack.com/
Link to Video-Only Immediate Access:
https://spxvideos.substack.com/
Summary of "What to Watch" Video Update for Monday, August 11th
The video provides a technical analysis of market trends, focusing on the S&P 500 and related indices, with a breakdown into positive, negative, and watchlist observations based on charts and indicators.
Positive Aspects
1. Market Performance:
The S&P 500 saw upward movement last week, particularly on Friday, closing above the R1 pivot point with a positive week overall.
Intraday charts (10-minute candlesticks) show gains held after reaching Thursday’s high.
The VIX (volatility index) dropped below 20, signaling reduced market fear compared to the prior week.
The NASDAQ and NASDAQ 100 hit new all-time closing highs, reflecting strength in growth stocks.
2. Growth vs. Value:
Growth-to-value ratios across various indices (S&P, large caps, NASDAQ 100 vs. Dow) are in uptrends, with some setting new highs.
Large-cap growth outperforms value, and the tech sector shows strength relative to other sectors.
3. Technical Indicators:
The S&P 500 is above key moving averages (20, 50, 100, 200-day, simple and exponential), which are trending upward.
Stocks above their 50-day and 100-day moving averages remain above 50%, indicating intermediate-term strength.
Anchored moving averages (tied to significant highs/lows) suggest support levels if prices decline.
Short-term trends (e.g., 10, 20, 30-period moving averages) are positive, with prices above these lines.
The Swenlin Trading Oscillator and weekly parabolic SAR are positive, and the advance-decline line is trending up.
4. Other Indices and Sectors:
The Russell 2000 (small caps) and mid-caps generated recent golden crosses (bullish signals), though small caps are moving sideways.
Financials, semiconductors, and the FANG index (mega-cap tech) are in uptrends.
Stock-to-bond ratios (e.g., S&P 1500 vs. short-term bonds, NASDAQ 100 vs. 3-7 year bonds) are positive, suggesting a market expectation of a soft landing (no recession).
Negative Aspects
1. Potential Bearish Signals:
A daily chart shows a possible bearish flag pattern in the S&P 500, with failure to break above previous highs.
Friday’s advance occurred on below-average volume, indicating a negative divergence.
The financial sector is underperforming the S&P 500, with a recent death cross in the financials-to-S&P ratio, raising concerns about sector weakness.
2. Internal Market Weakness:
New highs minus new lows in the S&P are trending down (5-day and 10-day moving averages), suggesting fewer stocks are driving the rally (e.g., Apple’s mega-cap influence).
The NYSE advance-decline line is declining on a closing basis, despite S&P gains, indicating broader market weakness.
The S&P McClellan Oscillator and NYSE McClellan Oscillator are below zero, though improving.
Momentum oscillators (short, intermediate, and long-term) are declining, and the bullish percent index for the NASDAQ 100 is below 50, a negative signal.
3. Other Divergences:
The equal-weighted S&P 500 is underperforming the cap-weighted version, showing uneven participation.
High-beta vs. low-beta and semis-to-tech ratios are declining, despite market highs.
The TTM squeeze and Chaiken Money Flow (smart money indicator #2) are negative, showing divergence as the S&P rises.
Watchlist
1. Economic Indicators:
Weekly jobless claims ticked up but remain below the moving average. Continuing claims (1.97M) are high, indicating prolonged unemployment, a concern to monitor.
The 10-year yield (below 4.5%) and the U.S. dollar (near its 50-day moving average at about 98) are stable but worth watching.
Treasury inflation-protected securities (TIPS) show no strong conviction, suggesting low inflation concerns.
2. Market Ratios and Sectors:
Staples-to-tech and staples-to-S&P ratios are rising slightly, which could signal defensive positioning.
Utilities are outperforming (potentially due to AI, crypto, and EV demand), causing ratios like hotels-to-utilities to decline.
Regional banks show weakness, a potential warning for the financial sector.
The S&P-to-utilities ratio is declining, indicating utilities’ relative strength.
3. Geopolitical and External Factors:
Oil prices may be impacted by a potential Trump-Putin meeting in Alaska (details unclear).
The spread between risky and non-risky bonds is stable, with low fear levels.
4. Other Observations:
Below-average volume is typical for summer but still a negative divergence.
PDF of Slides:
https://drive.google.com/file/d/1K7pmbUWcELne3l6BpTGygkRfdzsK_bKH/view?usp=sharing
DISCLAIMER This video is for entertainment purposes only. I am not a financial adviser, and you should do your own research and go through your own thought process before investing in a position. Trading is risky!
-
 37:25
37:25
The SPX Investing Program
7 hours agoWhat to Watch Update for Monday September 22, 2025
11 -
 1:55:20
The White House
8 hours agoPresident Trump Participates in the Memorial Service for Charlie Kirk
76K88 -
 1:02:41
Sarah Westall
6 hours agoDomestic Terror Operation: Death Threats, Smear Campaigns, Gang Stalking w/ Journalist Sarah Fields
20.8K4 -
 1:51:40
Nerdrotic
6 hours ago $0.45 earnedGobekli Tepe Discovery and "Reconstruction" | Forbidden Frontier #118
58.2K6 -
 29:07
29:07
Tactical Advisor
7 hours agoATF Changes Ruling on SBR & Tacpack unboxing | Vault Room Live Stream 039
56.7K15 -
 2:00
2:00
From Zero → Viral with AI
12 hours ago $0.73 earnedAre You Being Left Behind? Why AI Marketing is No Longer Optional
26.9K3 -
 9:10
9:10
BlackDiamondGunsandGear
10 hours agoI Finally Got it! / Now i need to BUILD IT!
19.5K6 -
 9:44
9:44
Millionaire Mentor
3 days agoCharlie Kirk Brings Woke Student To STUTTERING Over White Privilege Lies
24.1K7 -
 24:12
24:12
MudandMunitions
11 hours agoOff-Roading with NYPrepper Wild Elk & PA’s Most Remote Backroads
13.9K1 -
 DVR
DVR
Bannons War Room
7 months agoWarRoom Live
37.4M8.69K