Warning: SPX500 May Have Peaked—Here’s What the Charts Say
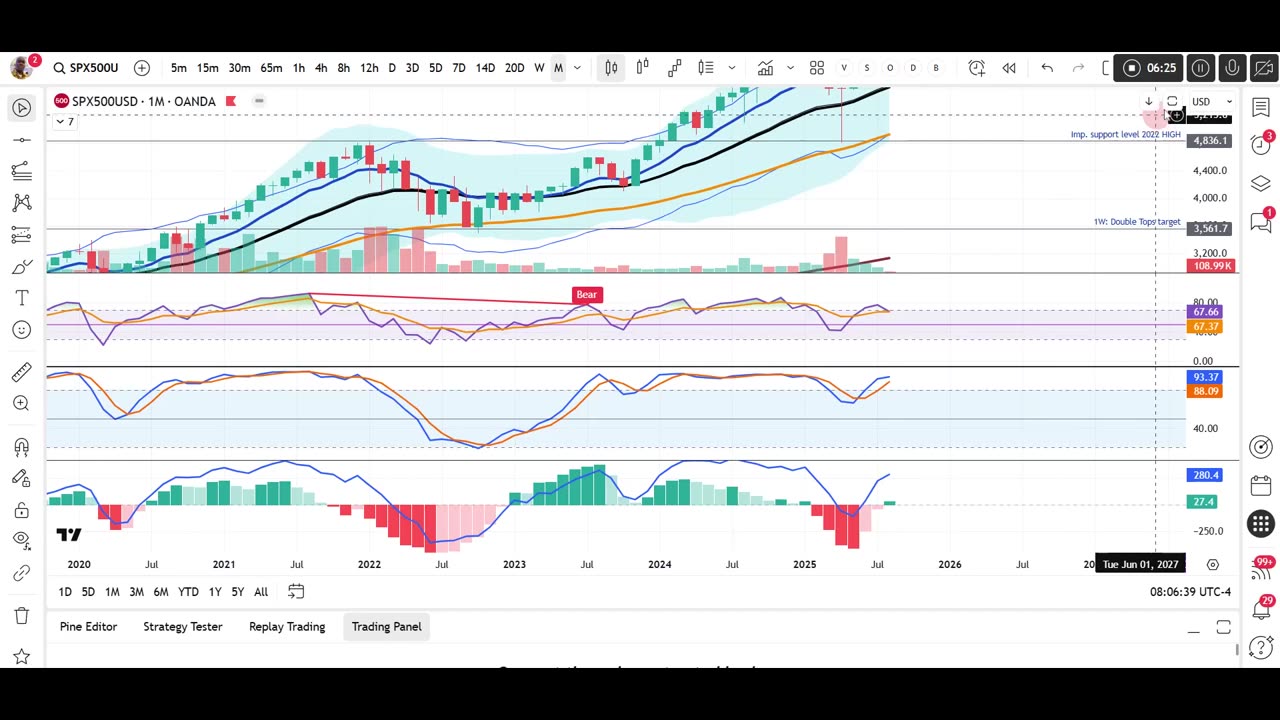
The S&P 500 (SPX500) may have reached its peak. In this video, I reveal the technical evidence pointing to a potential reversal—including monthly bearish divergence, daily and weekly reversal candles, and confirmation from key indicators.
This isn’t just noise—these signals align across timeframes, suggesting a shift in momentum that could lead to significant downside. I’ll walk you through the charts, explain the implications for traders and investors, and highlight critical support levels to watch.
Thank you for watching and have a great trading week. Cheers!!
Aug 9
Trade closed manually
Momentum has rekindled on the weekly chart, there is no strong divergences on the weekly candle too suggesting that the bearish engulfing candle from last week has been absorbed by bulls. 6226 support level has been strongly defended and SPX500 will go higher or at worst consolidate sideways between 6226 and 6442. Looking that the history, the only time this candle pattern showed up was Sept 9th, 2024 and SPX continued higher but with lots of hesitation.
-
 LIVE
LIVE
SpartakusLIVE
3 hours agoAim Assist NERFED - I LOVE IT || #1 Spartan Solo Session
291 watching -
 LIVE
LIVE
Adam Does Movies
8 hours agoBest Sci-Fi Movies! - Live
50 watching -
 LIVE
LIVE
Patriots With Grit
34 minutes agoWoke's Destruction of Men | Dr. Gilda Carle
62 watching -
 49:00
49:00
MattMorseTV
2 hours ago $10.81 earned🔴Musk is FINALLY talking about it…🔴
16.7K36 -

Sarah Westall
2 hours agoCDC Lawsuit, Genome Sequencing and Automated Medical Doctors w/ Dr. Nick and Leah Wilson
3.1K -
 LIVE
LIVE
Anthony Rogers
10 hours agoEpisode 392 - This is a Podcast
60 watching -
 1:19:29
Glenn Greenwald
5 hours agoJasmine Crockett: The Avatar of Democratic Emptiness; Bari Weiss Chooses Fanatical Israel Supporter as New CBS Anchor | SYSTEM UPDATE #556
93.2K42 -
 4:03:42
Barry Cunningham
1 day agoLIVE BREAKING NEWS: He's Back!! President Trump Hosts a Rally In Pennsylvania!
38.8K12 -
 7:53:09
Dr Disrespect
10 hours ago🔴LIVE - DR DISRESPECT - TARKOV 1.0 - THE VIOLENCE EVOLVES
97.7K7 -
 1:40:19
The White House
8 hours agoPresident Trump Delivers Remarks on the Economy
35.1K13