Premium Only Content

Deep Dive Update for Monday August 25, 2025
Link to The SPX Investing Program https://spxinvesting.substack.com
Link to The Daily Pivot Newsletter: https://thedailypivotnewsletter.substack.com/
Link to Video-Only Immediate Access:
https://spxvideos.substack.com/
This weekly deep dive video, prepared for August 25, 2025, analyzes market charts not regularly featured in daily updates to gain deeper insights into market trends. Key points:
Long-Term VIX (Volatility Index): Below 20, trending lower, signaling positive market conditions. A 50-period EMA shows a decline, MACD is flat, and RSI (9-period) is neutral, indicating stable volatility. VIX-S&P correlation is low, and the VVIX (volatility of VIX) ratio is declining, a bullish sign.
Sentiment and Volatility: The Ulcer Index remains low, reflecting minimal fear. The VIX-to-MOVE (bond volatility) ratio is decreasing, showing reduced volatility in stocks and bonds. The Skew Index is neutral, no longer anticipating a significant market move.
Market Ratios: Small caps outperformed large caps after Powell’s speech hinted at lower rates, pushing the large cap-to-small cap ratio down. Risk-on/risk-off and high-beta/low-beta ratios rose on Friday but remain choppy, offering limited insight.
Advance-Decline Lines: The NYSE cumulative advance-decline line hit an all-time high, but the S&P is lagging, showing a negative divergence. Volume trails price slightly, a minor concern. Broader market participation is positive, but a value stock bias suggests a defensive shift.
Technical Scores: NASDAQ leads at 77.9, followed by small caps at 77.2, a significant improvement. QQQs (growth) score 67.9, S&P is drifting lower, Dow is at 54.3 despite an all-time high, and mid-caps lag at 49.9 but are improving.
Trends and Resistance: Short- and intermediate-term trends are positive, with the S&P above key moving averages but stuck below resistance at 6468. Connors RSI is positive but not extreme. A triple top breakout on August 13 remains valid.
Divergences: The S&P 100 is underperforming the S&P 500, and the Dow’s high isn’t confirmed by transports (Dow Theory non-confirmation). The equal-weighted S&P hit a new high, unlike the market-cap-weighted S&P, signaling broader participation but also divergence.
Sectors and Markets: Regional banks improved (+4.66% Friday) but underperforming financials. Retail is in an uptrend but flattening relative to the S&P. Staples-to-tech and staples-to-S&P ratios are choppy, with staples briefly outperforming, indicating defensiveness. Gold-to-S&P and emerging-to-developed market ratios are sideways.
Bonds and Yields: No major inflation concerns; cash underperforming 3-7 year bonds. TIPS ratios are stable. The 10-year to 3-month yield curve is positive but choppy; a sustained inversion could signal recession risks. Eurozone stocks outperforming U.S. bonds.
Other Indicators: The S&P’s percentage above 50- and 200-day moving averages is rising, a positive sign. Long-term trends remain bullish, with the Special K oscillator positive.
The S&P 500 shows mixed signals: Friday’s rally boosted small caps and broader participation, but divergences, resistance at 6468, and a defensive value shift raise caution. The upcoming week will clarify if this is a sustainable trend or a short-lived reaction.
PDF of Slides:
https://drive.google.com/file/d/1qZR3Vnr8FsShMtFsXKOjGVwyPggJeFSz/view?usp=sharing
DISCLAIMER This video is for entertainment purposes only. I am not a financial adviser, and you should do your own research and go through your own thought process before investing in a position. Trading is risky!
-
 38:25
38:25
The SPX Investing Program
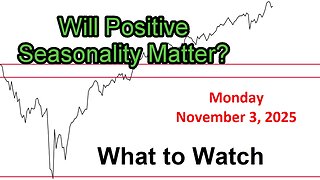
1 day agoWhat to Watch Update for Monday November 3, 2025
48 -
 LIVE
LIVE
Benny Johnson
1 hour ago🚨Trump Releases ALL Evidence Against James Comey in Nuclear Legal BOMBSHELL! It's DARK, US in SHOCK
5,344 watching -
 LIVE
LIVE
Badlands Media
9 hours agoBadlands Daily: November 4, 2025
3,499 watching -
 LIVE
LIVE
Wendy Bell Radio
6 hours agoBUSTED.
7,757 watching -
 UPCOMING
The Big Mig™
2 hours agoDing Dong The Wicked Witch Pelosi Is Gone
1265 -
 UPCOMING
Daniel Davis Deep Dive
1 hour agoFast Tracking Weapons to Ukraine, Close to $3 Billion /Lt Col Daniel Davis
25 -
 UPCOMING
The State of Freedom
3 hours ago#347 Relentlessly Pursuing Truth, Transparency & Election Integrity w/ Holly Kesler
28 -
 1:34:34
Graham Allen
2 hours agoThe MAGA “Civil War” Will LOSE The Midterms! Is A Fracture Coming? ALL Eyes On Key Races!
69.6K37 -
 20:28
20:28
Real Estate
1 month agoMILLIONS of Homeowners ARE LOSING MONEY NOW...
5.04K2 -
 22:35
22:35
Jasmin Laine
19 hours ago"They're Rude and Dismissive"—Poilievre Gets CBC To CONFESS On Camera
5.37K31