How to Create a Streamgraph in Python
How to Create a Streamgraph in Python | Easy Data Visualization Tutorial
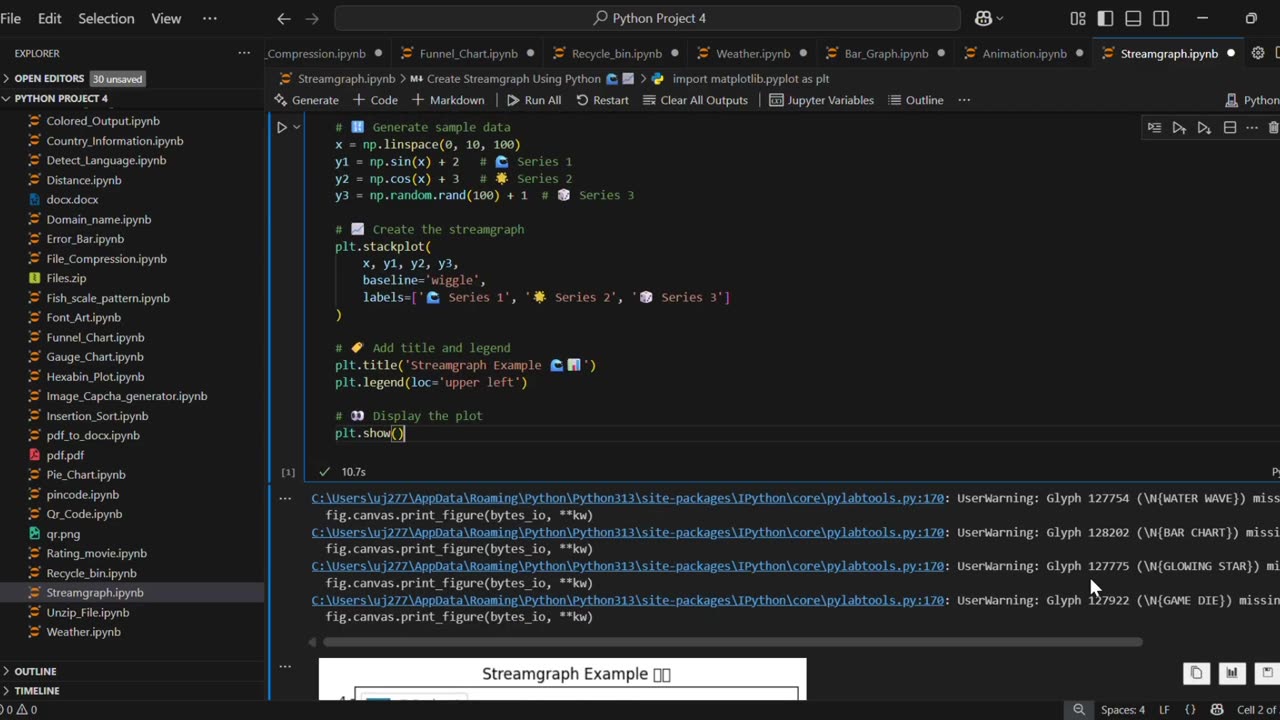
In this video, you’ll learn how to create a Streamgraph using Python and Matplotlib. A streamgraph is a type of stacked area chart with a smooth, flowing baseline, making it visually appealing for data visualization.
✅ What you’ll learn:
How to generate sample data in Python
How to plot a Streamgraph using matplotlib.stackplot()
Customize titles, labels, and legends for better visuals
This tutorial is beginner-friendly and perfect for anyone learning Python data visualization. 🚀
#Python #Matplotlib #DataVisualization #PythonProjects #Streamgraph #PythonForBeginners #PythonTutorial #LearnPython #PythonMatplotlib #PythonCharts
🔔 Subscribe for more Python, Data Science, and Data Visualization tutorials!
-
 0:18
0:18
AI Evolutionary Technology
30 days ago💰 Simple Currency Converter App in Python
19 -
 1:25:03
Jeff Ahern
3 hours ago $7.85 earnedThe Saturday Show with Jeff Ahern
56.3K8 -
 1:31:56
Michael Franzese
17 hours agoWill NBA do anything about their Gambling Problems?
113K22 -
 57:26
57:26
X22 Report
7 hours agoMr & Mrs X - The Food Industry Is Trying To Pull A Fast One On RFK Jr (MAHA), This Will Fail - EP 14
85.2K51 -
 2:01:08
LFA TV
1 day agoTHE RUMBLE RUNDOWN LIVE @9AM EST
142K11 -
 1:28:14
On Call with Dr. Mary Talley Bowden
5 hours agoI came for my wife.
15.3K20 -
 1:06:36
Wendy Bell Radio
10 hours agoPet Talk With The Pet Doc
51.9K28 -
 30:58
30:58
SouthernbelleReacts
2 days ago $7.50 earnedWe Didn’t Expect That Ending… ‘Welcome to Derry’ S1 E1 Reaction
38.7K10 -
 13:51
13:51
True Crime | Unsolved Cases | Mysterious Stories
5 days ago $17.84 earned7 Real Life Heroes Caught on Camera (Remastered Audio)
56.6K11 -
 LIVE
LIVE
Total Horse Channel
16 hours ago2025 IRCHA Derby & Horse Show - November 1st
109 watching