How to Create a Streamgraph in Python
How to Create a Streamgraph in Python | Easy Data Visualization Tutorial
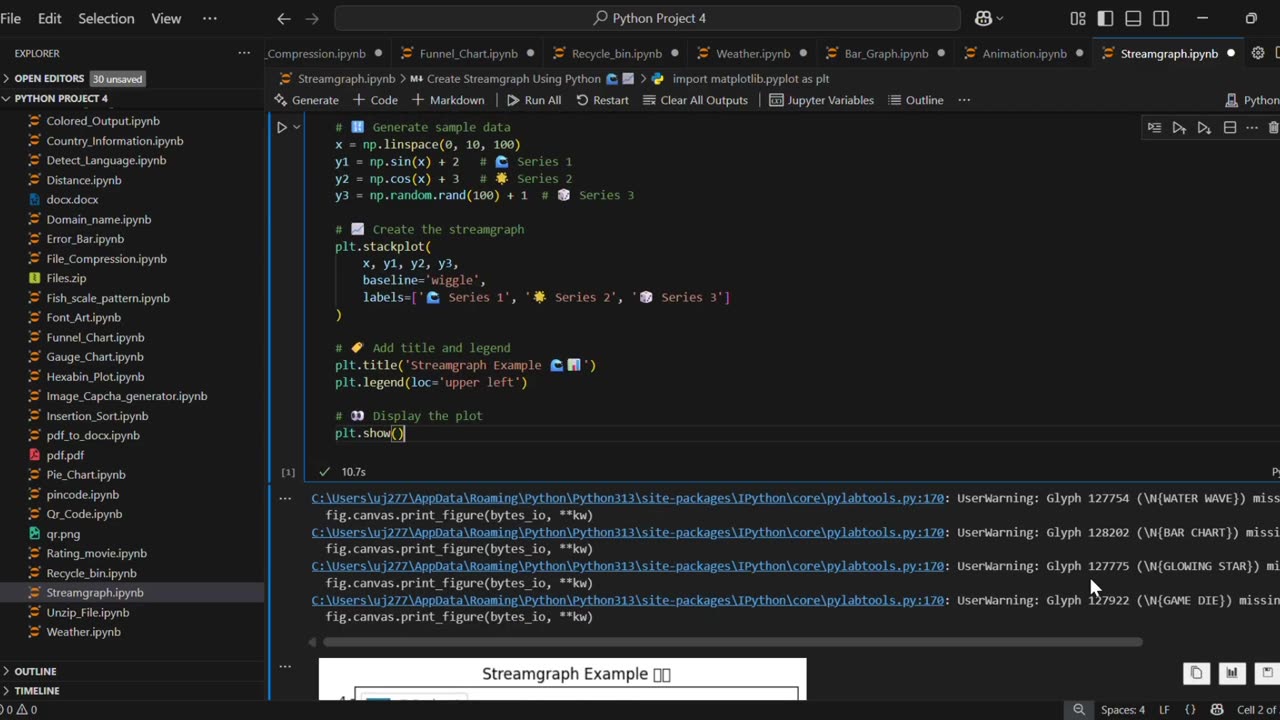
In this video, you’ll learn how to create a Streamgraph using Python and Matplotlib. A streamgraph is a type of stacked area chart with a smooth, flowing baseline, making it visually appealing for data visualization.
✅ What you’ll learn:
How to generate sample data in Python
How to plot a Streamgraph using matplotlib.stackplot()
Customize titles, labels, and legends for better visuals
This tutorial is beginner-friendly and perfect for anyone learning Python data visualization. 🚀
#Python #Matplotlib #DataVisualization #PythonProjects #Streamgraph #PythonForBeginners #PythonTutorial #LearnPython #PythonMatplotlib #PythonCharts
🔔 Subscribe for more Python, Data Science, and Data Visualization tutorials!
-
 0:18
0:18
AI Evolutionary Technology
2 months ago💰 Simple Currency Converter App in Python
41 -
 LIVE
LIVE
Steven Crowder
3 hours ago🔴 Australia Shooting: It's not the Guns it's Islam
26,013 watching -
 LIVE
LIVE
Nerdrotic
1 hour agoNerdrotic Nooner 543
282 watching -
 1:01:04
The Rubin Report
1 hour agoMSNOW Host Realizes Ilhan Omar Is a Monster After Her Australia Shooting Reaction
19.1K18 -
 LIVE
LIVE
The Bubba Army
3 days ago"ROB REINER MURDERED" By His Own Son? - Bubba the Love Sponge® Show | 12/15/25
451 watching -
 17:09
17:09
Professor Nez
1 hour agoObama’s Operative Just Got HUMILIATED After Trying to IMPEACH America!
9.8K12 -
 LIVE
LIVE
LFA TV
19 hours agoLIVE & BREAKING NEWS! | MONDAY 12/15/25
4,195 watching -
 59:10
59:10
VINCE
3 hours agoViolence Across The World: Brown University, Australia, Syria | Episode 188 - 12/15/25 VINCE
204K81 -
 LIVE
LIVE
The Shannon Joy Show
2 hours ago🔥SJ LIVE Dec 15 - A Violent Weekend, A Peoples Coup In Bulgaria & A Trump EO For Big Tech Granting Immunity & Supremacy🔥
178 watching -
 LIVE
LIVE
Grant Stinchfield
1 hour agoThe Cost of Wokeness... Disarmament Is the Danger
85 watching