How to Create a Streamgraph in Python
How to Create a Streamgraph in Python | Easy Data Visualization Tutorial
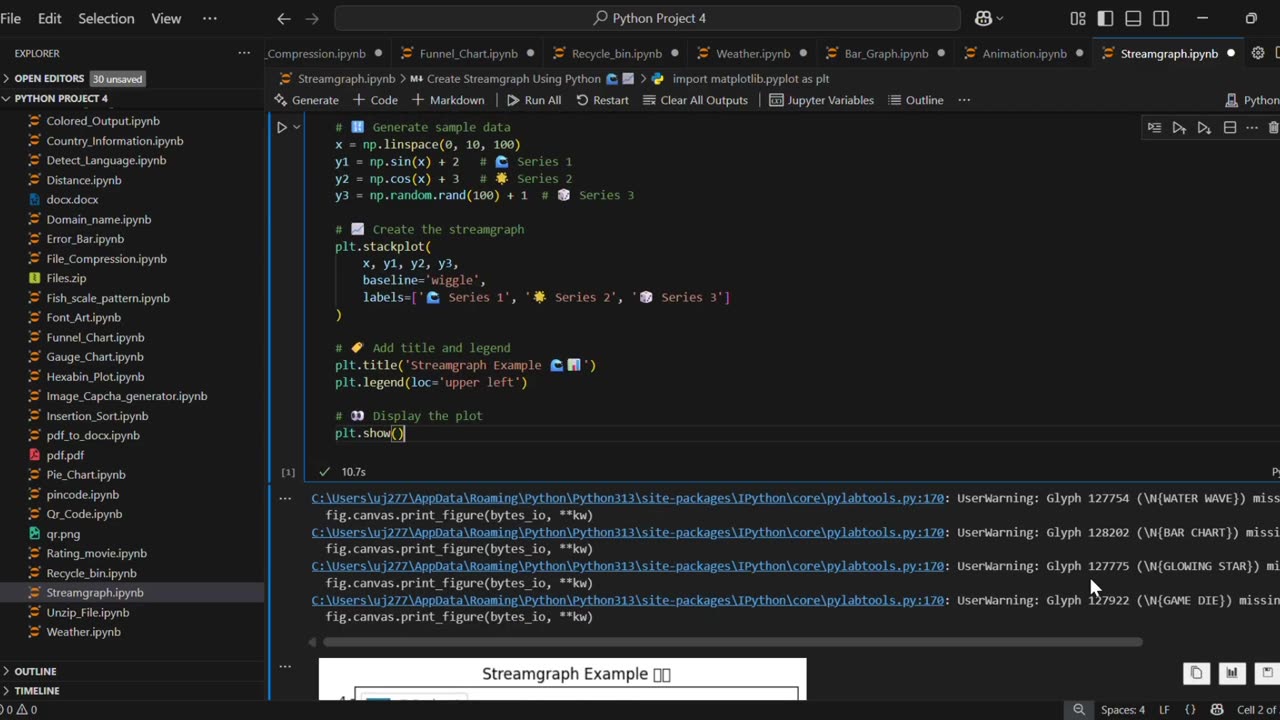
In this video, you’ll learn how to create a Streamgraph using Python and Matplotlib. A streamgraph is a type of stacked area chart with a smooth, flowing baseline, making it visually appealing for data visualization.
✅ What you’ll learn:
How to generate sample data in Python
How to plot a Streamgraph using matplotlib.stackplot()
Customize titles, labels, and legends for better visuals
This tutorial is beginner-friendly and perfect for anyone learning Python data visualization. 🚀
#Python #Matplotlib #DataVisualization #PythonProjects #Streamgraph #PythonForBeginners #PythonTutorial #LearnPython #PythonMatplotlib #PythonCharts
🔔 Subscribe for more Python, Data Science, and Data Visualization tutorials!
-
 1:02
1:02
AI Evolutionary Technology
13 days agoLive Weather App in Python | BeautifulSoup & Web Scraping Tutorial
21 -
 48:24
48:24
The Rubin Report
56 minutes agoPress Stunned by Trump’s Brutally Honest Reaction to James Comey Question
7.06K3 -
 LIVE
LIVE
Nikko Ortiz
2 hours agoADHD, Crashouts, and Karens - Rumble LIVE
259 watching -
 1:02:42
VINCE
3 hours agoComey Indicted, Soros Exposed: The Powder Keg Just Exploded | Episode 134 - 09/26/25
180K107 -
 LIVE
LIVE
Bannons War Room
7 months agoWarRoom Live
14,084 watching -

Benny Johnson
2 hours ago🚨James Comey INDICTED for Perjury and Obstruction, Years In JAIL | 275 FEDS in January 6th Crowd
30.1K23 -
 1:35:48
Dear America
3 hours agoBOMBSHELL: 274+ Feds Where in The Crowd On Jan 6th!! + James Comey Finally INDICTED!!
126K87 -
 LIVE
LIVE
Badlands Media
7 hours agoBadlands Daily: September 26, 2025
1,529 watching -
 2:44:51
Matt Kohrs
13 hours agoPCE Inflation Report, BTFD & Payday Friday || Live Trading Stock Market Open
49.7K1 -
 LIVE
LIVE
Wendy Bell Radio
7 hours agoWelcome To The "Find Out" Phase
6,752 watching