How to Create a Streamgraph in Python
How to Create a Streamgraph in Python | Easy Data Visualization Tutorial
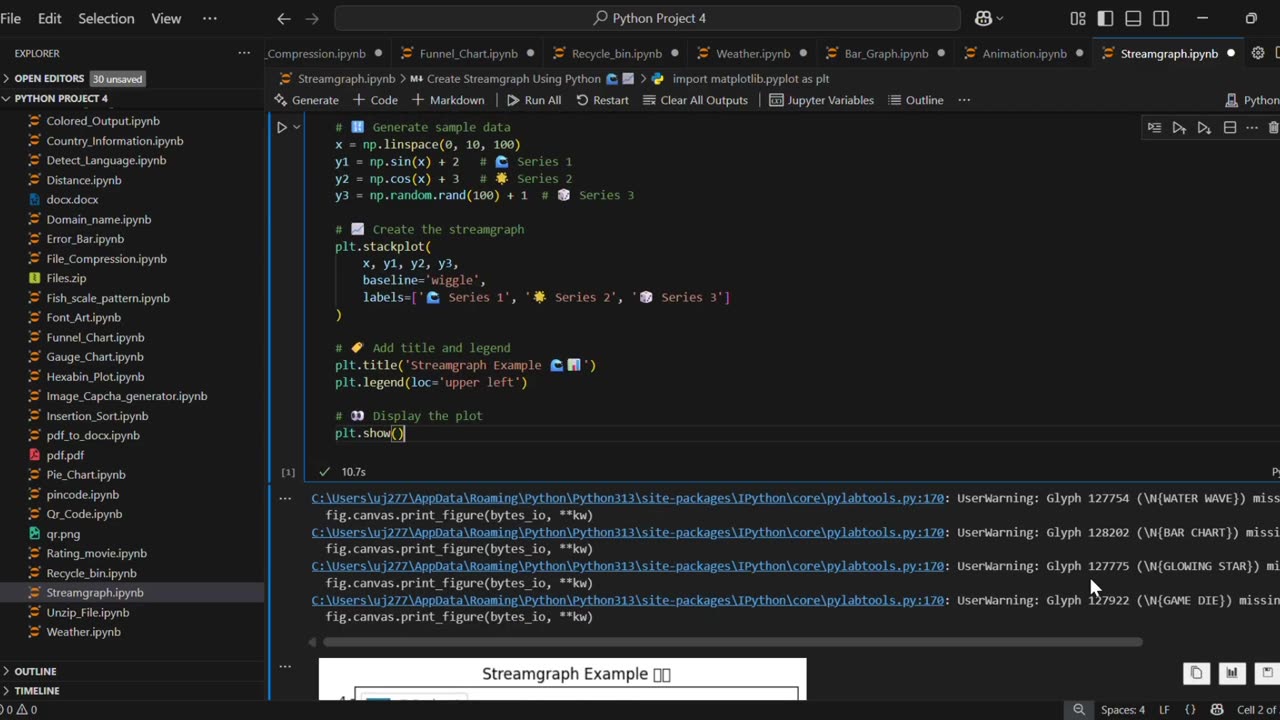
In this video, you’ll learn how to create a Streamgraph using Python and Matplotlib. A streamgraph is a type of stacked area chart with a smooth, flowing baseline, making it visually appealing for data visualization.
✅ What you’ll learn:
How to generate sample data in Python
How to plot a Streamgraph using matplotlib.stackplot()
Customize titles, labels, and legends for better visuals
This tutorial is beginner-friendly and perfect for anyone learning Python data visualization. 🚀
#Python #Matplotlib #DataVisualization #PythonProjects #Streamgraph #PythonForBeginners #PythonTutorial #LearnPython #PythonMatplotlib #PythonCharts
🔔 Subscribe for more Python, Data Science, and Data Visualization tutorials!
-
 0:17
0:17
AI Evolutionary Technology
3 months agoVisualizing Molecular Structure From SMILES Using RDKit 🧪
6 -
 24:39
24:39
GritsGG
10 hours agoWe Are The Regain Kings! We Refuse to Lose On Warzone!
11.4K2 -
 2:04:53
Sam Tripoli
11 hours ago $2.16 earned#949: Beware Of The Red Shoes With Shannon Rowan
5.26K3 -
 22:11
22:11
The Pascal Show
19 hours ago $1.09 earned'TPUSA IS LYING!' Candace Owens DOUBLES DOWN On Charlie Kirk Theories! Is Erika Kirk Lying?!
11.2K2 -
 1:53:05
TruthStream with Joe and Scott
1 day agoNick Alvear: The positive and negative of AI, it's use in film and his new animated series Lucky Larry on GoodLion.TV other topics, Roxiva Light Therapy, Yoga Nidra: Live 12/14/25 #527
7.87K5 -
 3:11:53
The Shuli Network
13 hours agoEXCLUSIVE Hidden Camera Footage Of Stuttering John | The Uncle Rico Show
18.8K11 -
 LIVE
LIVE
Lofi Girl
2 years agoSynthwave Radio 🌌 - beats to chill/game to
547 watching -
 24:10
24:10
MetatronCore
3 days agoNerdrotic is AWESOME
7.84K2 -
 3:38
3:38
Blabbering Collector
2 days agoUnboxing Noble Collection: Hogwarts House Crest Tree Ornaments!
7.46K2 -
 1:08:29
omarelattar
1 day agoThe BioHacking Experts: “How We Lost 150lbs, Healed Naturally & Reversed Aging in 9 Months!”
28.1K4