How to Create a Streamgraph in Python
How to Create a Streamgraph in Python | Easy Data Visualization Tutorial
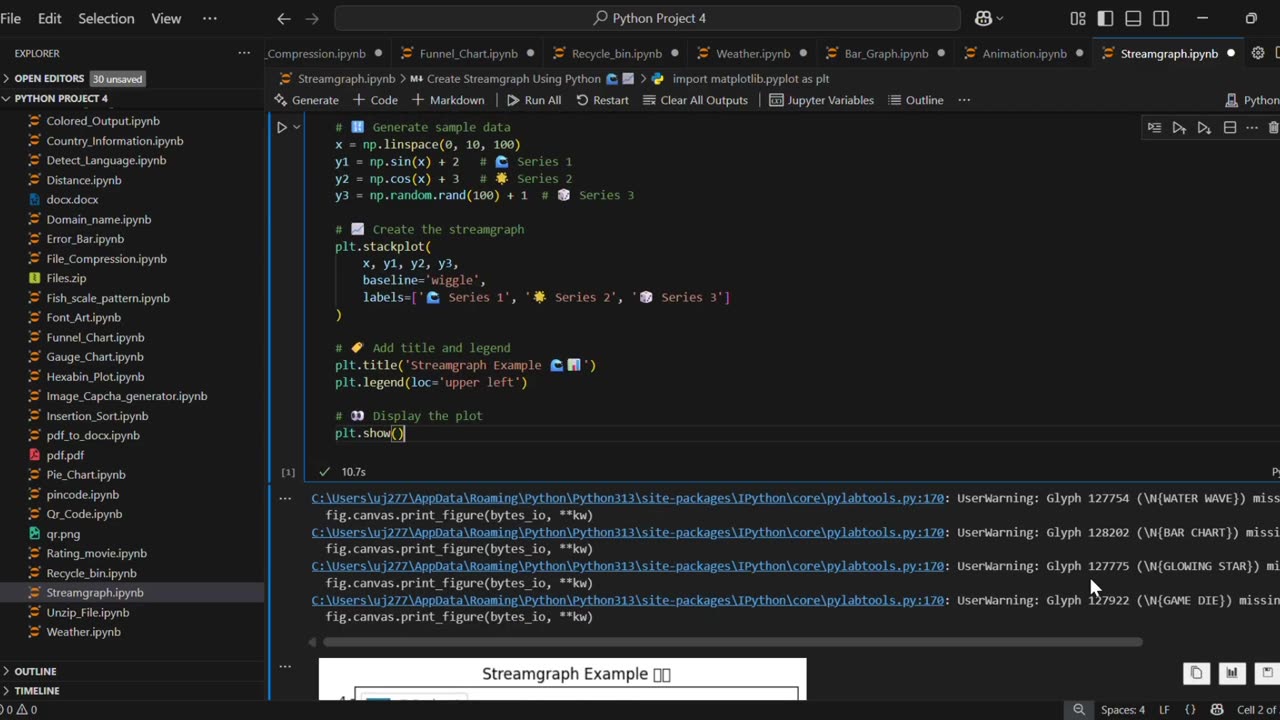
In this video, you’ll learn how to create a Streamgraph using Python and Matplotlib. A streamgraph is a type of stacked area chart with a smooth, flowing baseline, making it visually appealing for data visualization.
✅ What you’ll learn:
How to generate sample data in Python
How to plot a Streamgraph using matplotlib.stackplot()
Customize titles, labels, and legends for better visuals
This tutorial is beginner-friendly and perfect for anyone learning Python data visualization. 🚀
#Python #Matplotlib #DataVisualization #PythonProjects #Streamgraph #PythonForBeginners #PythonTutorial #LearnPython #PythonMatplotlib #PythonCharts
🔔 Subscribe for more Python, Data Science, and Data Visualization tutorials!
-
 0:17
0:17
AI Evolutionary Technology
3 months agoVisualizing Molecular Structure From SMILES Using RDKit 🧪
6 -
 LIVE
LIVE
Dr Disrespect
3 hours ago🔴LIVE - DR DISRESPECT - ARC RAIDERS - NEW COLD SNAP UPDATE
1,404 watching -
 LIVE
LIVE
LFA TV
14 hours agoLIVE & BREAKING NEWS! | TUESDAY 12/16/25
4,441 watching -
 1:01:57
VINCE
3 hours agoThis Could Win Us The Midterms | Episode 189 - 12/16/25 VINCE
168K139 -
 LIVE
LIVE
The Mel K Show
1 hour agoMORNINGS WITH MEL K- The End of Zero Sum Game Theory Thinking Has Arrived - 12-16-25
580 watching -
 LIVE
LIVE
The Shannon Joy Show
55 minutes agoSJ LIVE Dec 16 - TACO Trump Flees California After Judge Orders Him To Remove Troops! Plus The Bitcoin Collapse & AI Bubble W/ Fin-Analyst Jack Gamble!
159 watching -
 57:04
57:04
efenigson
2 hours agoSentenced For Building Freedom! Live: Samourai Wallet's Keonne Rodriguez
4.4K3 -
 1:56:02
Benny Johnson
2 hours agoDark New Mysterious Footage Of Brown University Killer RELEASED After Republican Leader MURDERED...
25.2K14 -
 DVR
DVR
Chad Prather
2 hours agoWhy Trump’s Response To Rob Reiner Passing MISSED THE MARK + Erika Kirk & Candace Meet & Bible Q&A!
2.99K6 -
 1:59:07
Badlands Media
9 hours agoBadlands Daily: 12/16/25
23.2K8