How to Create a Streamgraph in Python
How to Create a Streamgraph in Python | Easy Data Visualization Tutorial
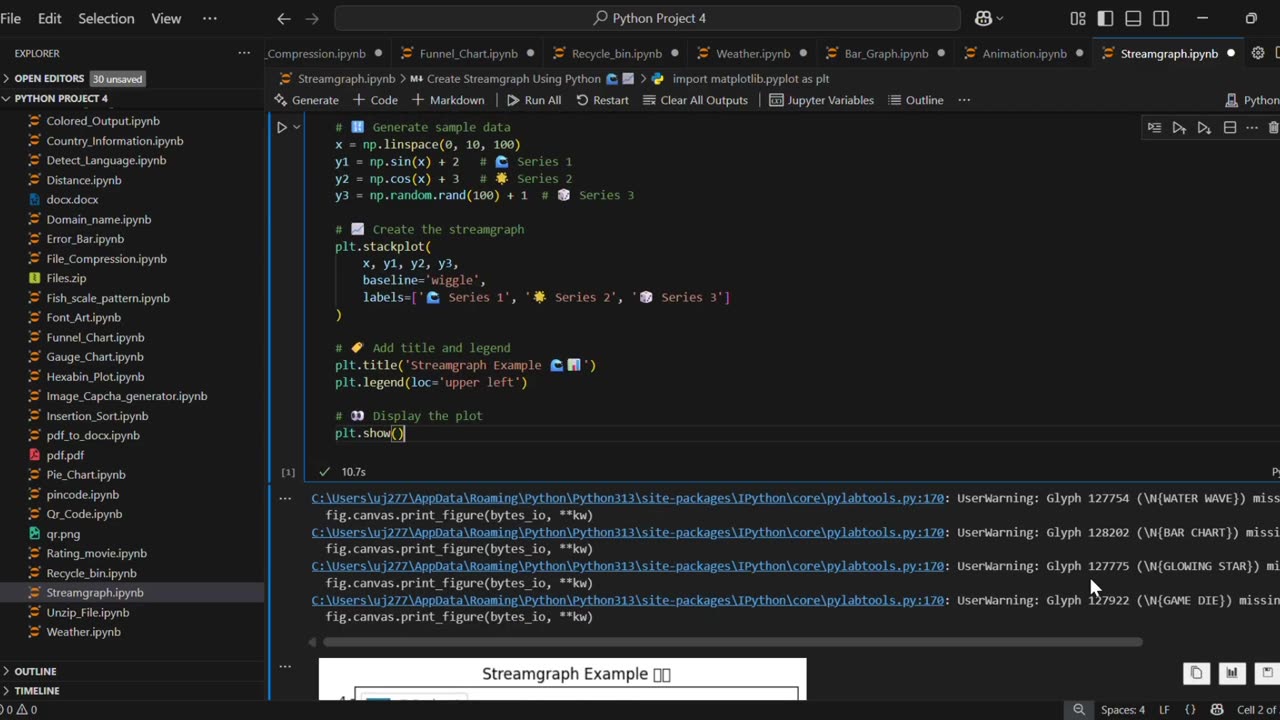
In this video, you’ll learn how to create a Streamgraph using Python and Matplotlib. A streamgraph is a type of stacked area chart with a smooth, flowing baseline, making it visually appealing for data visualization.
✅ What you’ll learn:
How to generate sample data in Python
How to plot a Streamgraph using matplotlib.stackplot()
Customize titles, labels, and legends for better visuals
This tutorial is beginner-friendly and perfect for anyone learning Python data visualization. 🚀
#Python #Matplotlib #DataVisualization #PythonProjects #Streamgraph #PythonForBeginners #PythonTutorial #LearnPython #PythonMatplotlib #PythonCharts
🔔 Subscribe for more Python, Data Science, and Data Visualization tutorials!
-
 1:15
1:15
AI Evolutionary Technology
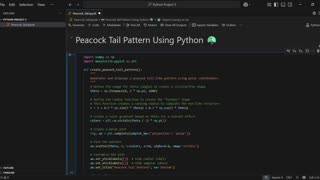
14 days agoCreating a Stunning Peacock Tail Pattern with Python & Matplotlib
41 -
 3:28:14
Badlands Media
23 hours agoThe Narrative Ep. 39: The Sovereign Mind
89.8K31 -
 2:17:35
TheSaltyCracker
7 hours agoThe Charlie Kirk Effect ReeEEStream 9-21-25
106K284 -
 2:03:07
vivafrei
7 hours agoEp. 283: Charlie Kirk Memorial and other Stuff in the Law World
204K152 -
 9:13:12
The Charlie Kirk Show
18 hours agoLIVE NOW: Building A Legacy, Remembering Charlie Kirk
2.15M900 -
 1:55:20
The White House
10 hours agoPresident Trump Participates in the Memorial Service for Charlie Kirk
94.3K90 -
 1:02:41
Sarah Westall
9 hours agoDomestic Terror Operation: Death Threats, Smear Campaigns, Gang Stalking w/ Journalist Sarah Fields
48.1K7 -
 1:51:40
Nerdrotic
9 hours ago $14.74 earnedGobekli Tepe Discovery and "Reconstruction" | Forbidden Frontier #118
77.7K9 -
 29:07
29:07
Tactical Advisor
9 hours agoATF Changes Ruling on SBR & Tacpack unboxing | Vault Room Live Stream 039
88.1K16 -
 2:00
2:00
From Zero → Viral with AI
15 hours ago $3.95 earnedAre You Being Left Behind? Why AI Marketing is No Longer Optional
47.1K5