How to Create a Streamgraph in Python
How to Create a Streamgraph in Python | Easy Data Visualization Tutorial
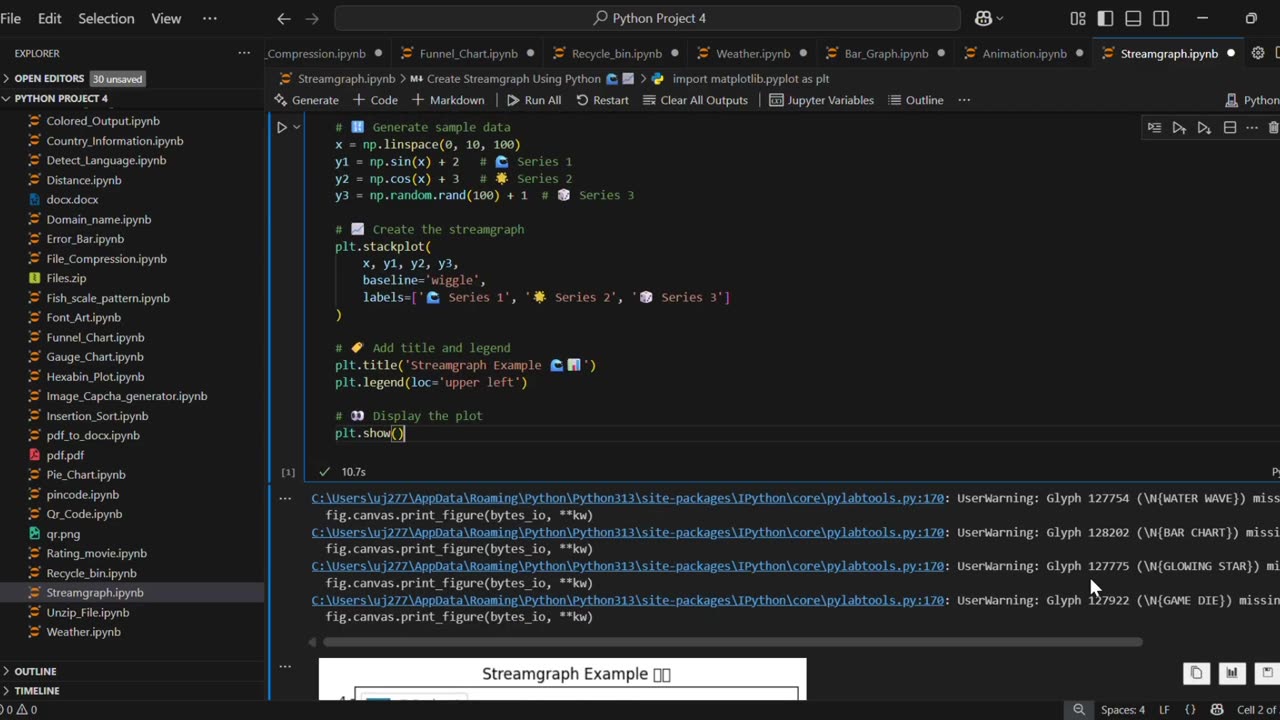
In this video, you’ll learn how to create a Streamgraph using Python and Matplotlib. A streamgraph is a type of stacked area chart with a smooth, flowing baseline, making it visually appealing for data visualization.
✅ What you’ll learn:
How to generate sample data in Python
How to plot a Streamgraph using matplotlib.stackplot()
Customize titles, labels, and legends for better visuals
This tutorial is beginner-friendly and perfect for anyone learning Python data visualization. 🚀
#Python #Matplotlib #DataVisualization #PythonProjects #Streamgraph #PythonForBeginners #PythonTutorial #LearnPython #PythonMatplotlib #PythonCharts
🔔 Subscribe for more Python, Data Science, and Data Visualization tutorials!
-
 1:05
1:05
AI Evolutionary Technology
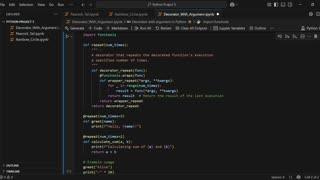
4 days agoCreate Your Own Python Decorator | Repeat Functions Like a Pro
7 -
 LIVE
LIVE
Sarah Westall
1 hour agoSuicide Pacts forming in Youth Social Media Groups - Discord, Reddit, TikTok w/ John Anthony
408 watching -
 2:25:31
vivafrei
11 hours agoEp. 281: Charlie Kirk; Routh Trial; Charlotte Train; Bolsanaro Defense; SCOTUS & MORE!
72.5K81 -
Turning Point USA
3 hours agoWASHINGTON D.C. PRAYER VIGIL FOR CHARLIE KIRK
24.8K11 -

The Mel K Show
2 hours agoMel K & Tim James | Healing is an Inside Job | 9-14-25
6.07K1 -
 LIVE
LIVE
IsaiahLCarter
5 hours agoCharlie Kirk, American Martyr (with Mikale Olson) || APOSTATE RADIO 028
206 watching -
 16:43
16:43
Mrgunsngear
9 hours ago $0.80 earnedKimber 2K11 Pro Review 🇺🇸
2.77K9 -
 13:40
13:40
Michael Button
1 day ago $0.17 earnedThe Strangest Theory of Human Evolution
4484 -
 10:19
10:19
Blackstone Griddles
1 day agoMahi-Mahi Fish Tacos on the Blackstone Griddle
8711 -
 23:51
23:51
Jasmin Laine
1 day ago“Stop Wasting My Time!”—Trump's BRUTAL WARNING To Canada As Poilievre ROASTS CBC LIVE
1.74K15