The Graph That’s Everywhere: y = mx + b Explained
Every straight line follows one simple rule: y = mx + b.
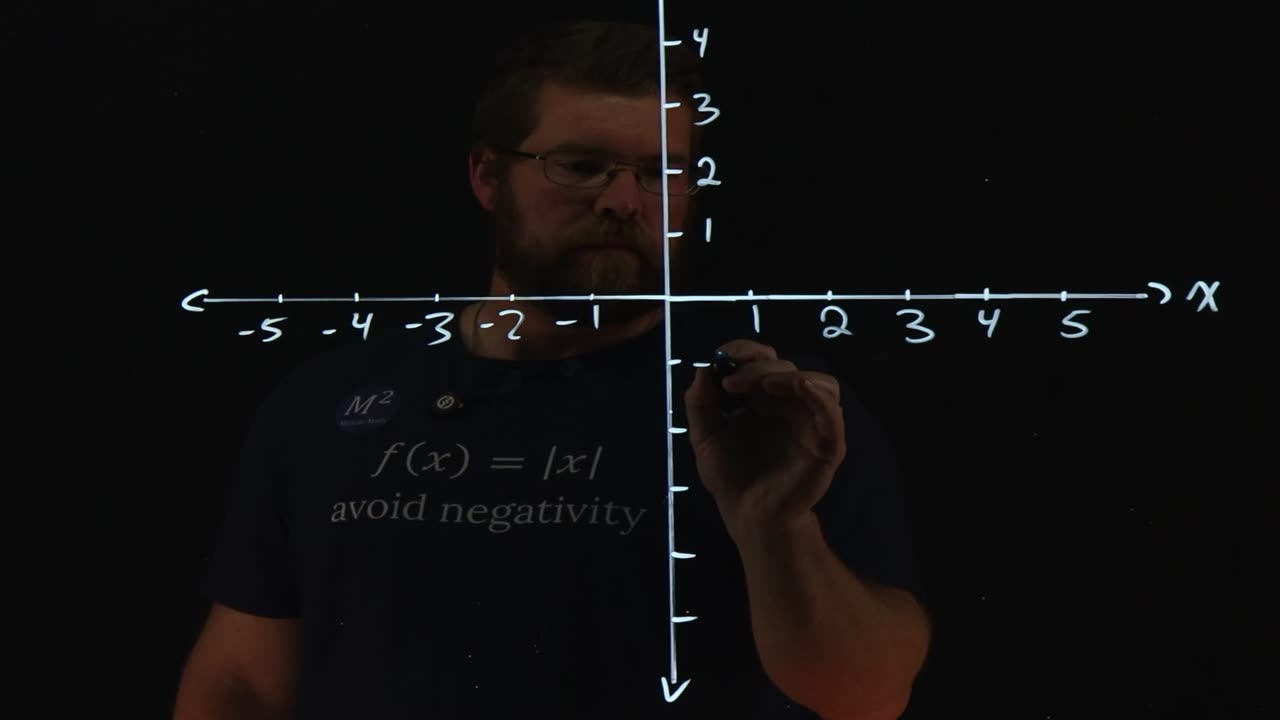
This short visual breakdown shows what the slope (m) and y-intercept (b) mean — and how changing them transforms your graph.
Perfect for Algebra 1, Pre-Algebra, or SAT Math review.
Linear Equations Practice Sheets:
https://www.teacherspayteachers.com/Product/Algebra-1-Chapter-2-Bundle-Linear-Equations-Functions-Editable-14315884
Comment if this finally made slope-intercept form make sense.
#MathHelp #MinuteMath #MathMadeSimple #MathTutorial #MathSkills #Education #Math #CommonCoreMath #MathLessons #MathVideos
Teacher resources:
https://minutemath.com/product-category/faculty-resources/
More math help and merch:
https://minutemath.com/
Follow us:
Twitter: https://twitter.com/minutemath
Instagram: https://www.instagram.com/minutemath/
TikTok: https://www.tiktok.com/@therealminutemath
Facebook: https://www.facebook.com/MinuteMath/
Business IG: https://www.instagram.com/minutebusinessacademy/
Amazon: https://www.amazon.com/shop/minutemath
TPT: https://www.teacherspayteachers.com/Store/Minutemath
Personal IG: https://www.instagram.com/gannonforpresident/
-
 2:32:21
MattMorseTV
9 hours ago $71.08 earned🔴Los Angeles RIOTS.🔴
292K416 -
 1:05:39
Matt Walsh
14 hours agoThe Solution To The Immigration Problem That No One Is Talking About | Ep. 1726
28K192 -
 2:04:27
TimcastIRL
9 hours agoDON LEMON ARRESTED | Timcast IRL #1439
278K95 -
 6:03:38
Drew Hernandez
1 day agoDON LEMON ARRESTED THEN RELEASED WITHOUT BAIL, HOMAN DRAW DOWN & NEW EPSTEIN FILES?
53.9K18 -
 13:56
13:56
Robbi On The Record
1 day ago $4.92 earnedWhy Everyone Is Deleting TikTok (billionaires, control & immigration)
49.2K18 -
 11:35
11:35
Dr. Nick Zyrowski
2 days agoHow To REVERSE Poor Eyesight ( Especially After 40 )
42.2K10 -
 59:06
59:06
The Rubin Report
12 hours agoPlan ₿ Forum El Salvador Day 1 Recap | Dave Rubin
136K7 -
 57:14
57:14
BonginoReport
12 hours agoDon Lemon ARRESTED: Why It Matters More Than You Think - Nightly Scroll w/ Hayley Caronia (Ep.225)
156K120 -
 11:08:58
Plan ₿ Forum
8 days agoPlan ₿ Forum El Salvador 2026 – Day 1 Live from the WAGMI Stage
261K17 -
 2:46:22
Laura Loomer
12 hours agoEP168: STAGED?! Ilhan Omar Uses Fake "Attack" To Cover Up Somali Fraud
81.3K39