Nasdaq 100 Technical Analysis – Big Move Ahead for NDX? 📊
📊 Nasdaq 100 Technical Analysis – Big Move Ahead for NDX?
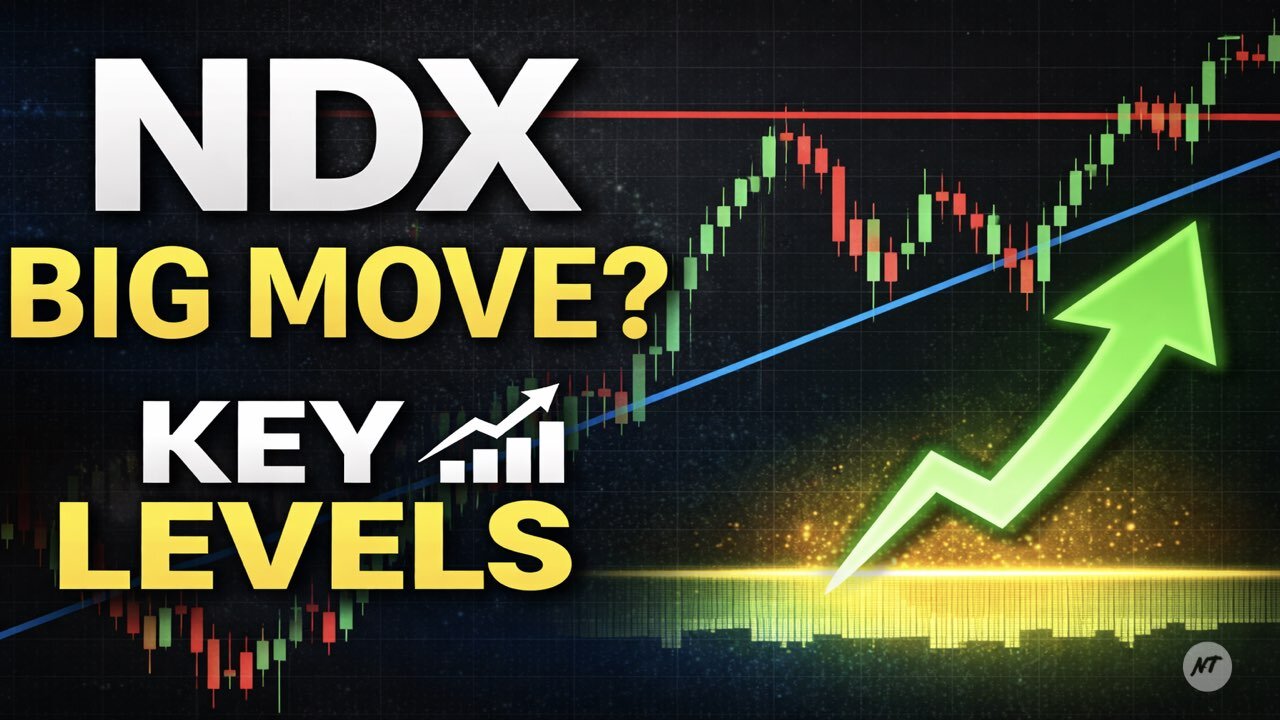
The Nasdaq 100 (NDX) is approaching a critical technical zone. In this video, I break down the NDX price chart using clean price action to determine whether a major breakout or breakdown is coming.
No indicators. No noise. Just structure.
🔍 What you’ll learn in this analysis:
• Nasdaq 100 (NDX) market structure explained
• Key support & resistance levels
• Breakout vs breakdown scenarios
• Bullish and bearish paths forward
• Short-term and mid-term outlook for NDX
• How traders should prepare for a big move
📈 Whether you trade indices, stocks, or macro-driven markets, this breakdown gives you a clear technical roadmap for what comes next.
⏱️ Chapters
00:00 – Intro
00:13 – NDX chart analysis
04:20 – Final thoughts
👇 Your take:
Do YOU expect the Nasdaq 100 to break higher — or roll over from here?
Drop your scenario or price target in the comments.
#Nasdaq100 #NDX #StockMarket #TechnicalAnalysis #PriceAction #Trading #Indices #MarketAnalysis
⚡ Like the video if you value clean, no-indicator technical analysis
🔔 Subscribe for weekly crypto & stock market breakdowns
💰 Start Trading with Bonuses:
▪️ Trade Republic (2% interest + bonus): https://ref.trade.re/ngppnh8x
▪️ eToro: https://etoro.tw/3NApJgm
▪️ Bybit: https://www.bybit.nl/invite?ref=XGJXDB
📱 Join the NakedTrader Community
▪️ Twitter/X: @NakedTrader3
▪️ Telegram: Team NakedTrader
▪️ Instagram: @NakedTrader3
▪️ TikTok: @NakedTrader3
🍕 Support the channel: https://bmc.link/NakedTrader
🌐 Visit: NakedTrader.org | NakedTrader.net | NakedTrader.nl
⚠️ Disclaimer:
This video is for educational purposes only and is NOT financial advice. Always do your own research before making investment decisions.
-
 20:04
20:04
NakedTrader – Crypto & Stock Technical Analysis | Bitcoin, Altcoins, Price Action
1 month agoBitcoin & Ethereum at Key Levels – Stocks & Altcoins Weekly Outlook 📊
911 -
 6:59
6:59
Gun Owners Of America
18 hours agoBBC Reporters Get Schooled On The Second Amendment
5.3K2 -
 29:46
29:46
Brad Owen Poker
22 hours ago $0.63 earnedI Hit QUADS, FULL HOUSES, And FLUSHES! WILD Player Falls For TRAP & OVERBETS HUGE! Poker Vlog Ep 363
5.14K1 -
 LIVE
LIVE
BEK TV
23 hours agoTrent Loos in the Morning - 1/28/2026
145 watching -
 18:04
18:04
Actual Justice Warrior
14 hours agoWoman Says Black Girl Magic Means She Can STEAL Mansion
51.1K25 -
 19:54
19:54
Code Blue Cam
21 hours agoPolice Chase Ends in the Worst Crash Ever
15.7K3 -
 47:07
47:07
Coin Stories with Natalie Brunell
21 hours agoDr. Shawn Baker: How Big Food, Big Pharma & Bad Money Made America Sick
21.4K5 -
 1:58:50
MG Show
20 hours agoTrump's Calls Walz & Frey – Homan Leads, Local Law Enforcement Crushes Agitators
20.4K19 -
 12:10
12:10
MattMorseTV
15 hours ago $13.97 earnedTrump PLAN has Dems. PANICKING.
82.2K117 -
 18:55
18:55
Nikko Ortiz
1 day agoMilitary Clips Gone Wrong #5...
17.7K7