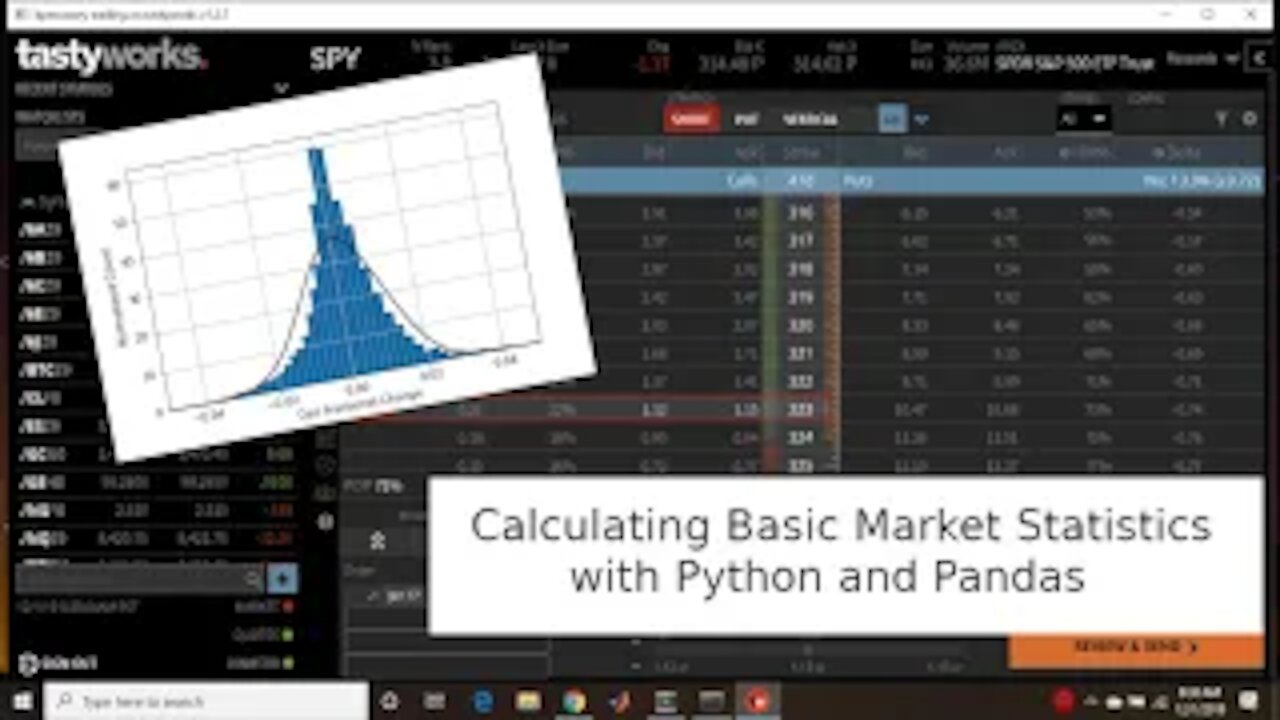
Calculating Simple Statistics with Python and Pandas: Stock Market Data
4 years ago
52
A really simple video this time. We use Numpy/Scipy and Pandas to calculate some simple statistics on the daily returns of the S&P 500 index. Specifically, we calculate the mean, standard deviation, skewness, and kurtosis. I also talk about generating a histogram and modifying the plot to represent a density.
Github: https://github.com/kpmooney/numerical_methods_youtube/tree/master/market_analysis
Tip Jar: https://paypal.me/kpmooney
Loading comments...
-
 0:18
0:18
StockMarketAndMore
4 years ago $0.36 earnedStock market
1.86K4 -
 28:19
28:19
Bits-N-Bytes
5 years agoData Verification with Python (Ep. 10)
121 -
 26:46
26:46
kpmooney
4 years agoSolving Simple Physics Problems with Python/Scipy - Motion in one dimension
37 -
 10:05
10:05
hotboy229
5 years ago $2.62 earnedStock market crash new lockdown
2.68K4 -
 21:49
21:49
Richest You with Tom Sweeney
4 years ago $0.19 earnedIs Stock Market Manipulation LEGAL?
4718 -
 3:03
3:03
BlueDiamond
4 years ago $0.07 earnedVODKA BRANDS CORP - Stock Market Symbol VDKB
5222 -
 0:15
0:15
KTNV
5 years agoStock market surges after vaccine effectiveness
13K1 -
 34:31
34:31
Bits-N-Bytes
5 years agoPython Data Types
275 -
 0:10
0:10
Shelisa45
5 years agoStock Market is on Steroids
97 -
 1:07
1:07
RenzoRants
5 years agoTrump On The Stock Market!
1231