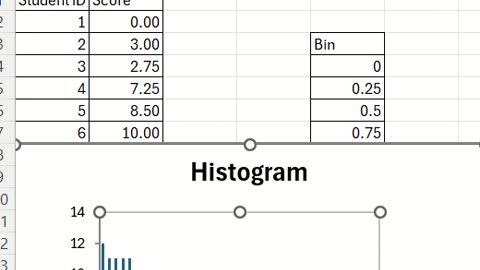
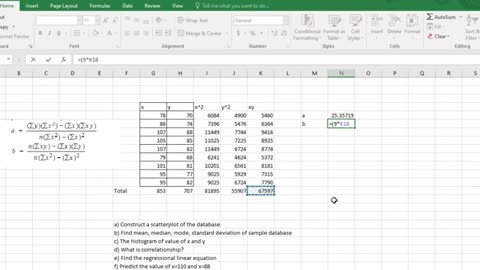
1 year agoStatistics Help: Excel to make Regression Line, Scatterplot, Correlationship, Histogramsaxi753
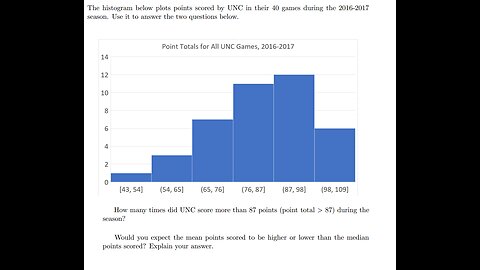
1 year agoStatistics Help: The Histogram below plots points scored by UNC in their 40 games during 2016-2017saxi753
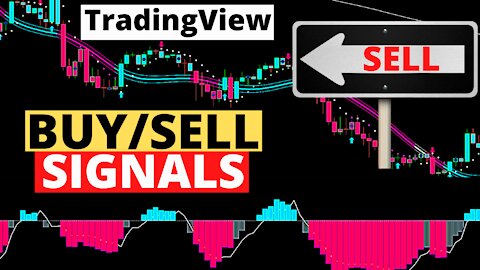
3 years agoReview: “The Most Accurate Buy Sell Signal Indicator - 100% Profitable Trading Strategy"Trader's LandingVerified
6 months agoThe Best Way to Measure Bullet Seating & Ogive Position (Extreme Reloading Special Edition)God, Guns, & Family Man
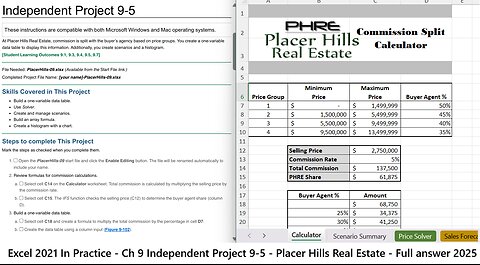
4 months agoExcel 2021 In Practice - Ch 9 Independent Project 9-5 - Placer Hills Real Estate (Full answer 2025)saxi753
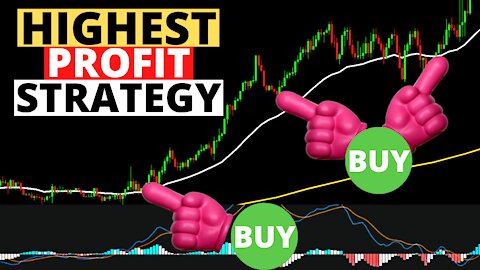
3 years agoReview: HIGHEST PROFIT Trading Strategy On YouTube Proven 100 Trades - MTF Indicator + MACDTrader's LandingVerified