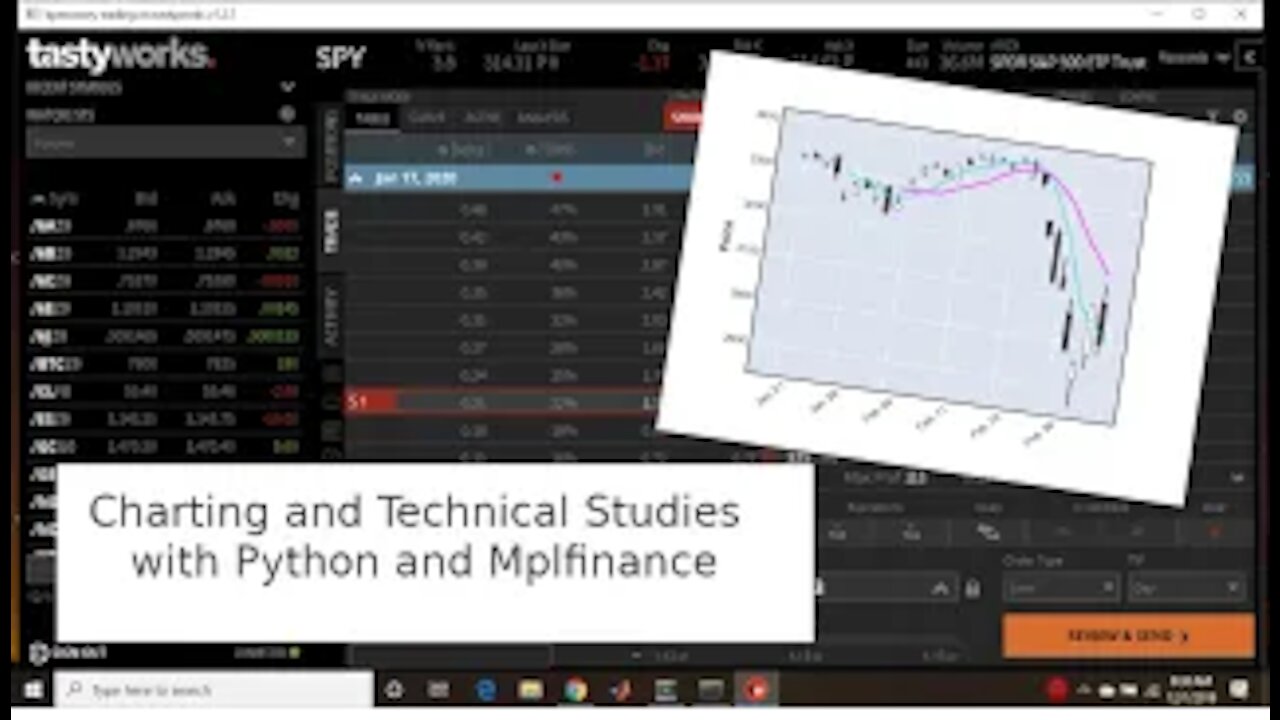
Candlestick Charts and Technical Studies Using Python and mplfinance
4 years ago
28
We use Matplotlib and Mplfinance to make some candlestick charts and add some technical studies, in this case, moving averages. We also show how to calculate moving averages in Pandas.
This is a simple, quick video. Hopefully if you're into charting and technical analysis (I’m not) this will point you in a potential direction for coding up your own stuff.
mplfinance: https://github.com/matplotlib/mplfinance
Github: https://github.com/kpmooney/numerical_methods_youtube/tree/master/market_analysis
Tip Jar: https://paypal.me/kpmooney
Loading comments...
-
 7:52
7:52
monsterMatt
5 years agoPython Importing and Using Classes
192 -
 2:22
2:22
Age of Discovery
4 years ago $0.02 earnedUsing Python and Notepad++ for Reality Programming
186 -
 4:56
4:56
monsterMatt
5 years agoImporting and Using Custom Classes in Python
114 -
 21:36
21:36
kpmooney
4 years agoCalculating Implied Volatility from an Option Price Using Python
134 -
 18:24
18:24
kpmooney
4 years agoProbability of a Touch in Finance using Python Monte Carlo Methods
41 -
 11:24
11:24
kpmooney
4 years agoCalculating the Implied Volatility of a Put Option Using Python
10 -
 8:43
8:43
Matea Vasileski
4 years agoCreate a Map of UFO Reports Using Python and Plotly in Under 10 Minutes
16 -
 0:24
0:24
Fire Rescue Videos
4 years agoHug Angle Technical Rescue Training
292 -
 21:36
21:36
kpmooney
4 years agoMore Kinematics problems: Differential Equations and Event Detection using Python (Numpy and Scipy)
37 -
 18:18
18:18
Donald Feury
4 years ago $0.01 earnedHow to remove the silent parts of a video using ffmpeg and python
29